Graph & Chart List
Chart Finder Tool
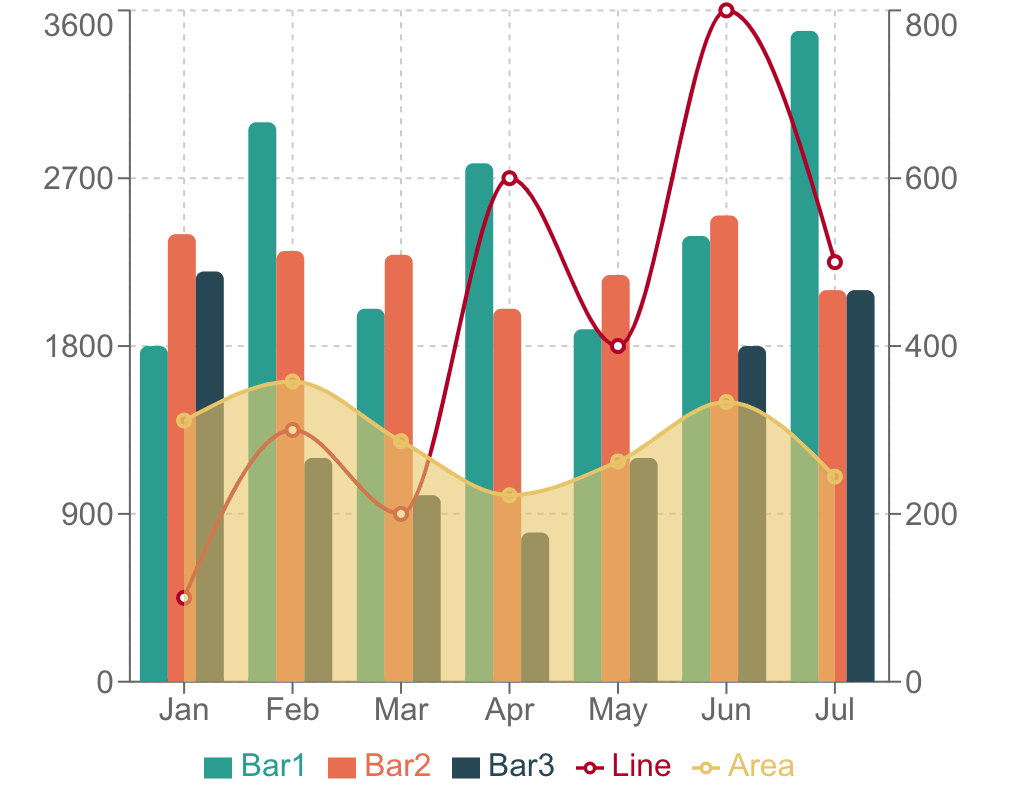
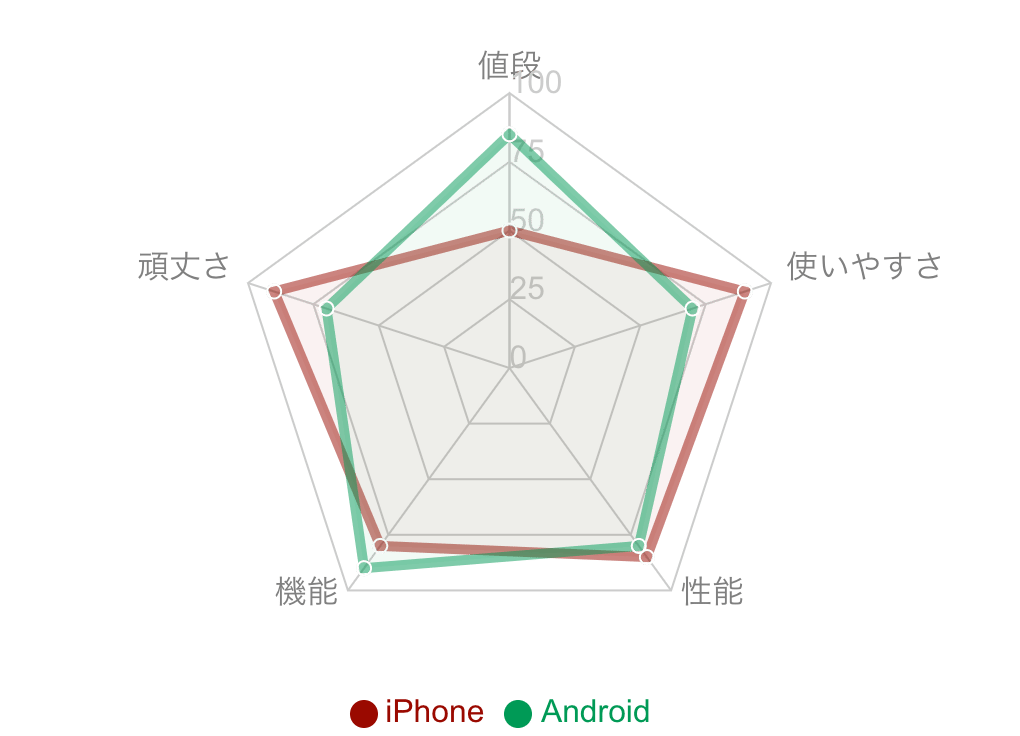
Comparison (3)
Compare the magnitude of values across multiple items
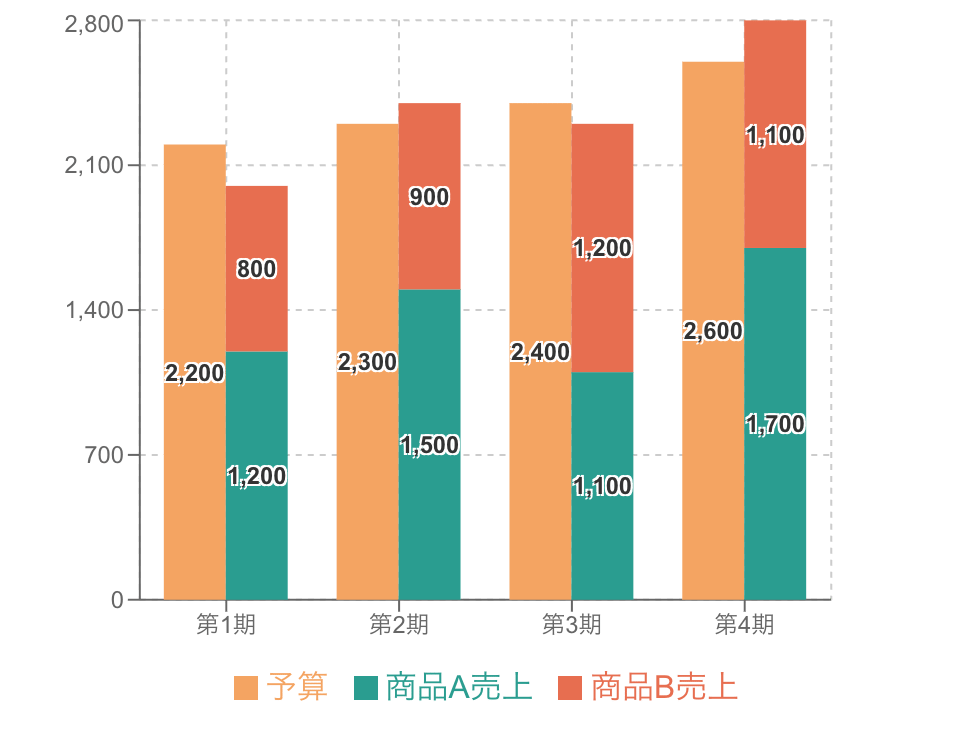
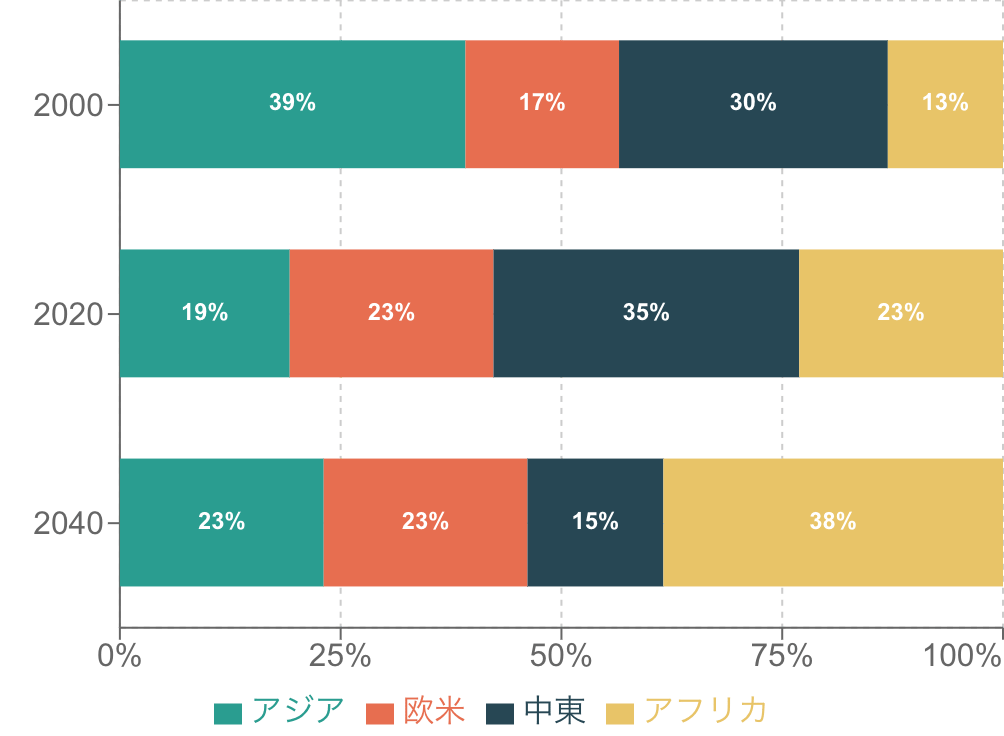
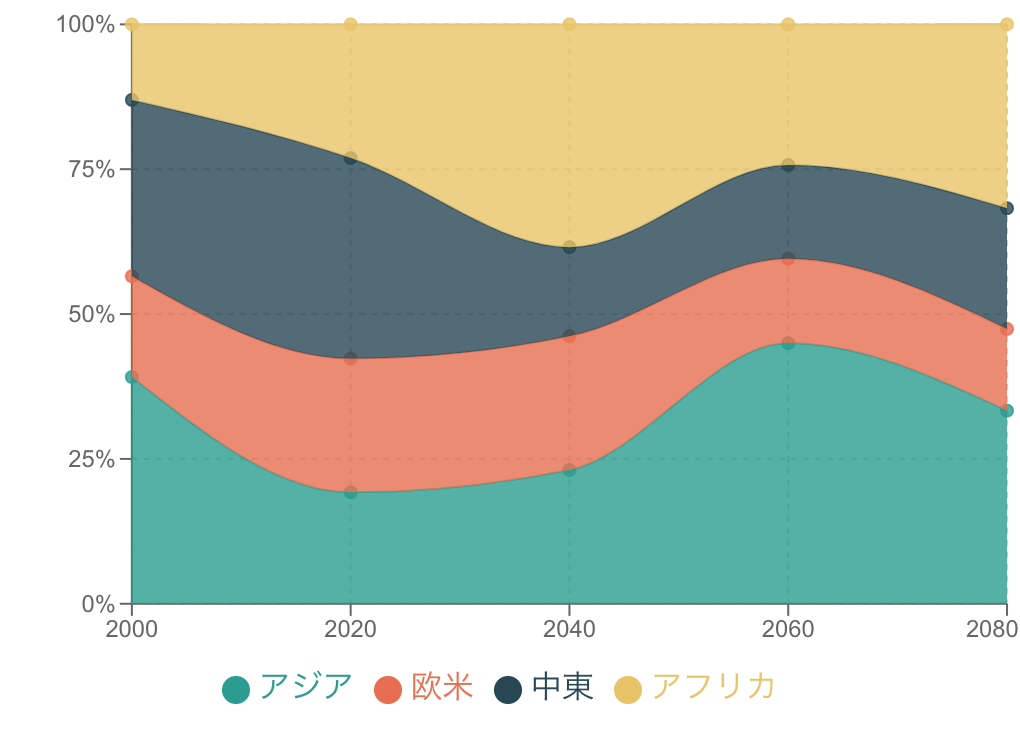
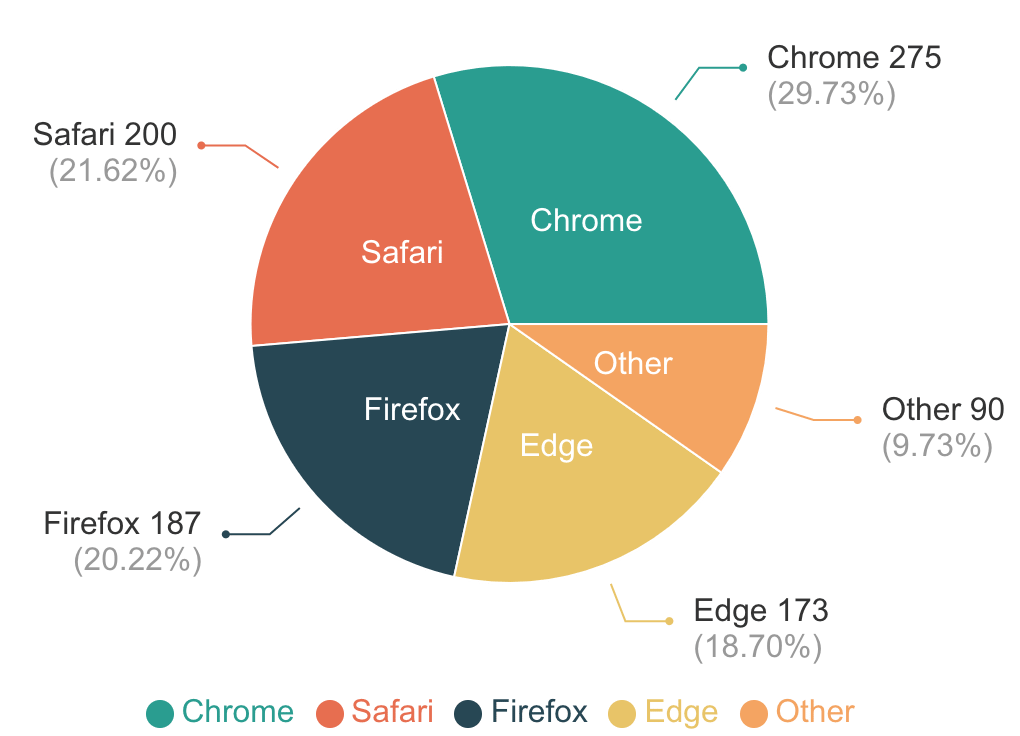
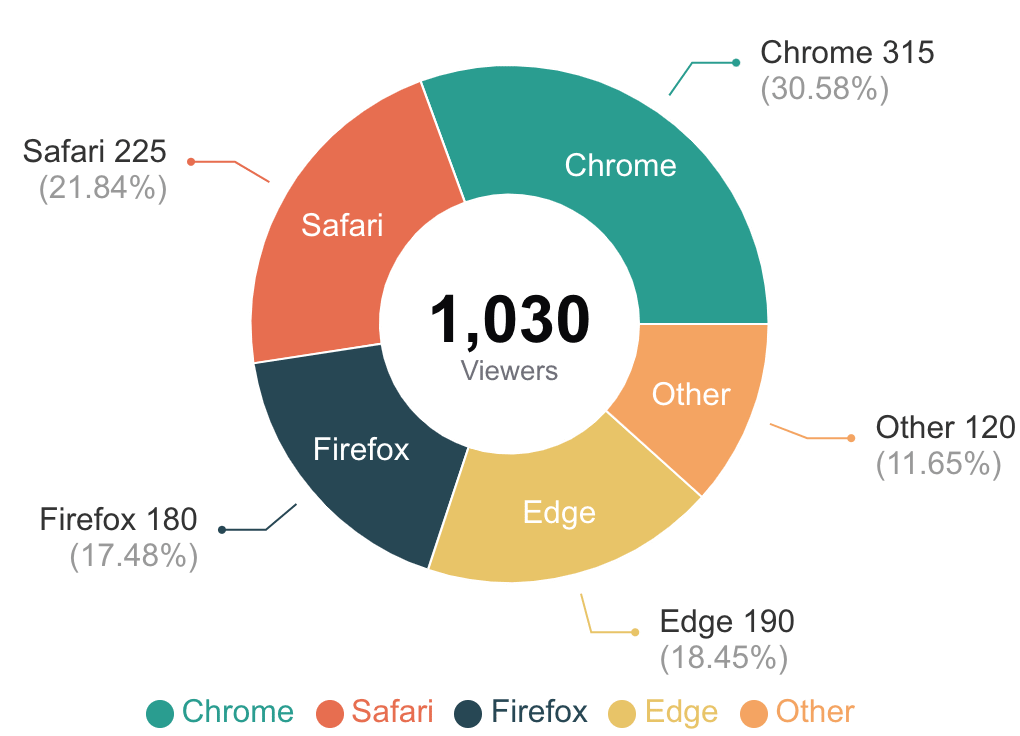
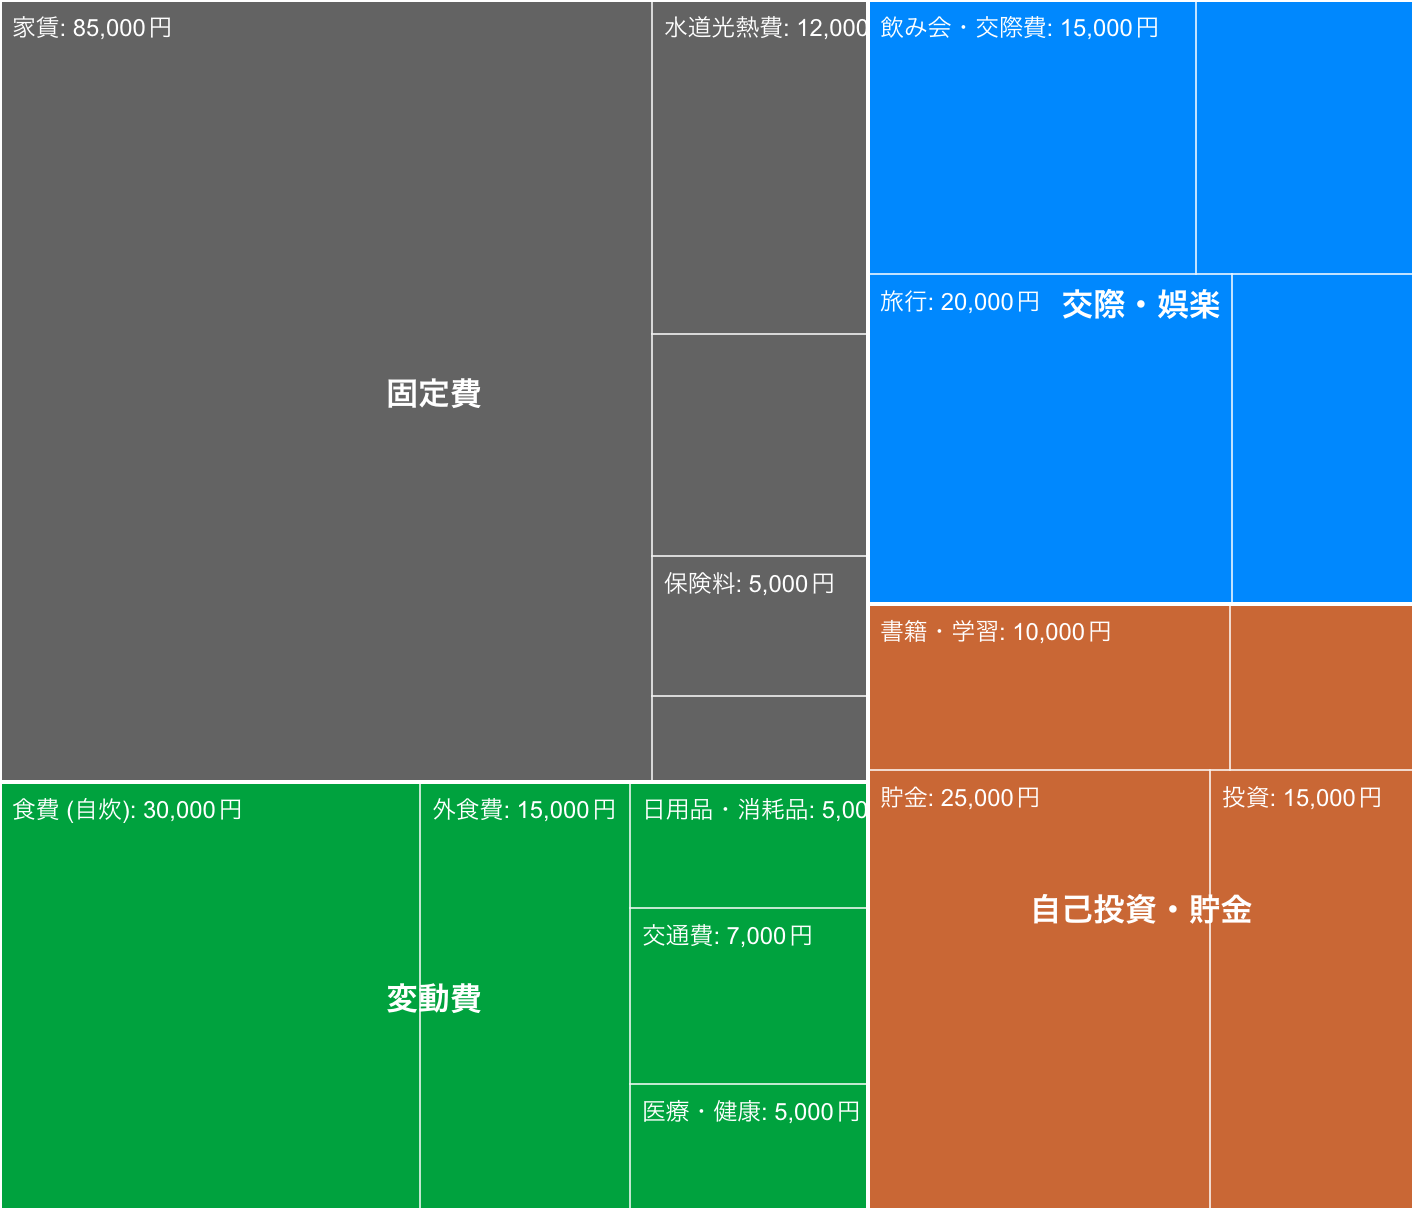
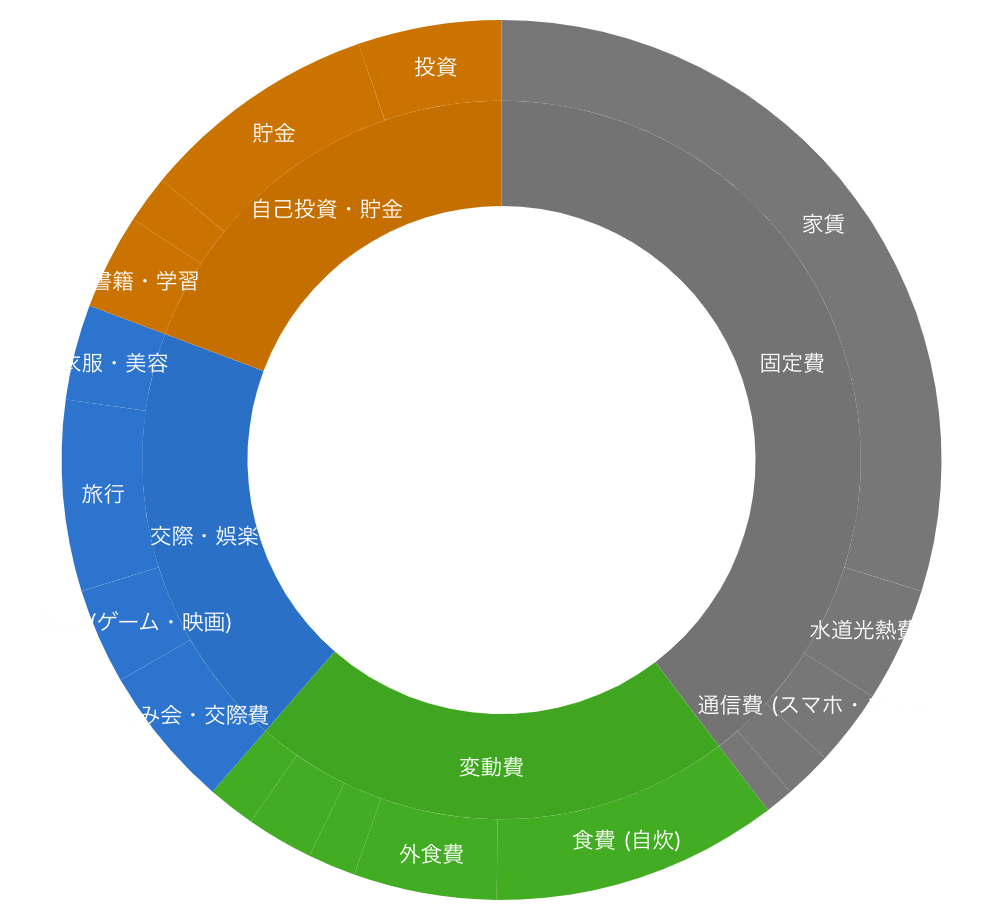
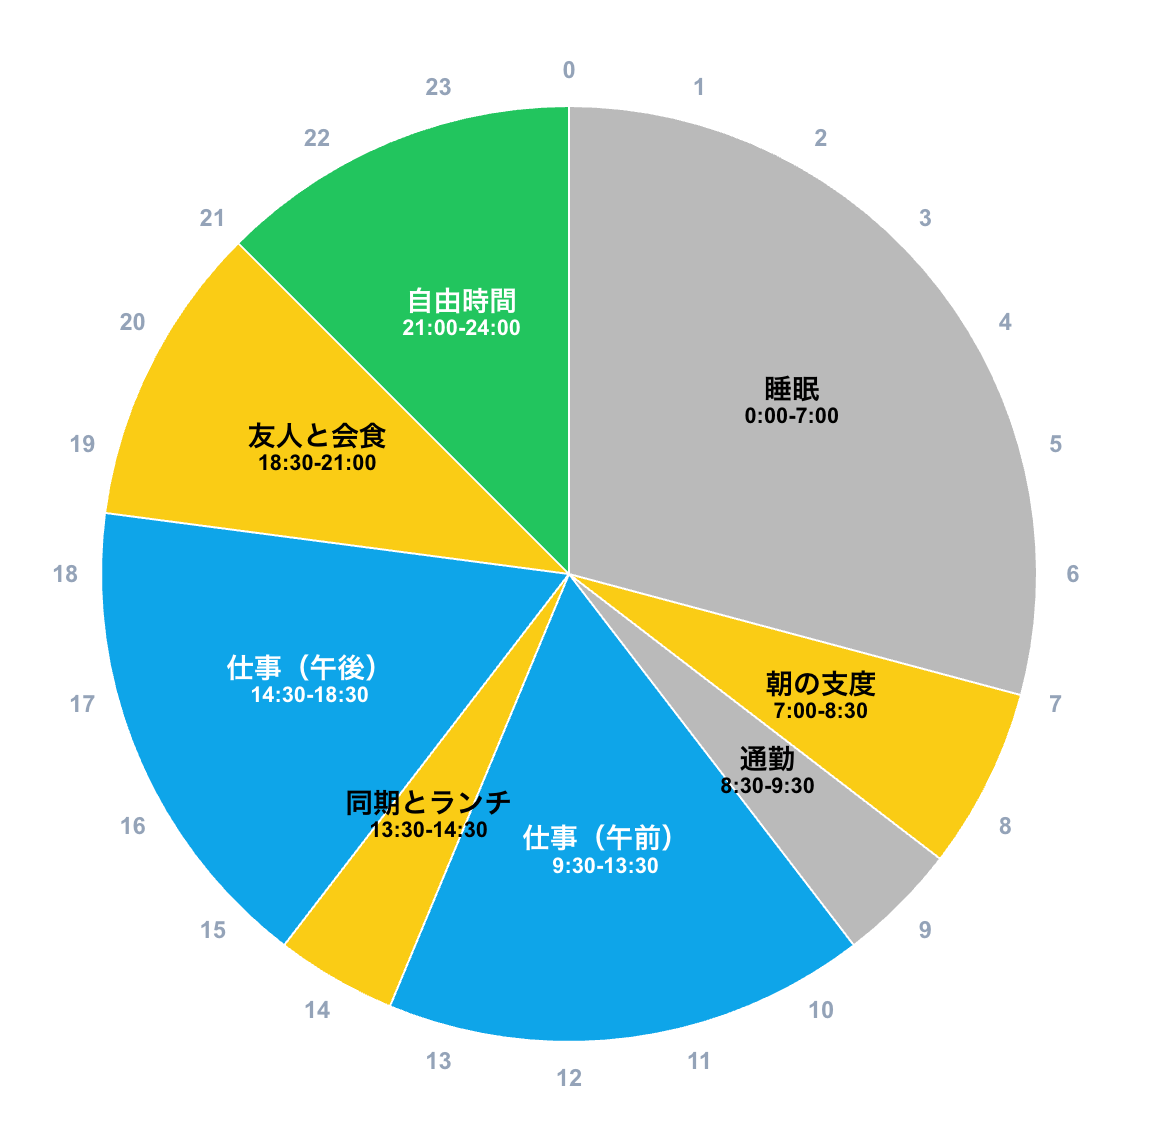
Composition (15)
Show the proportion or composition of each item within the whole
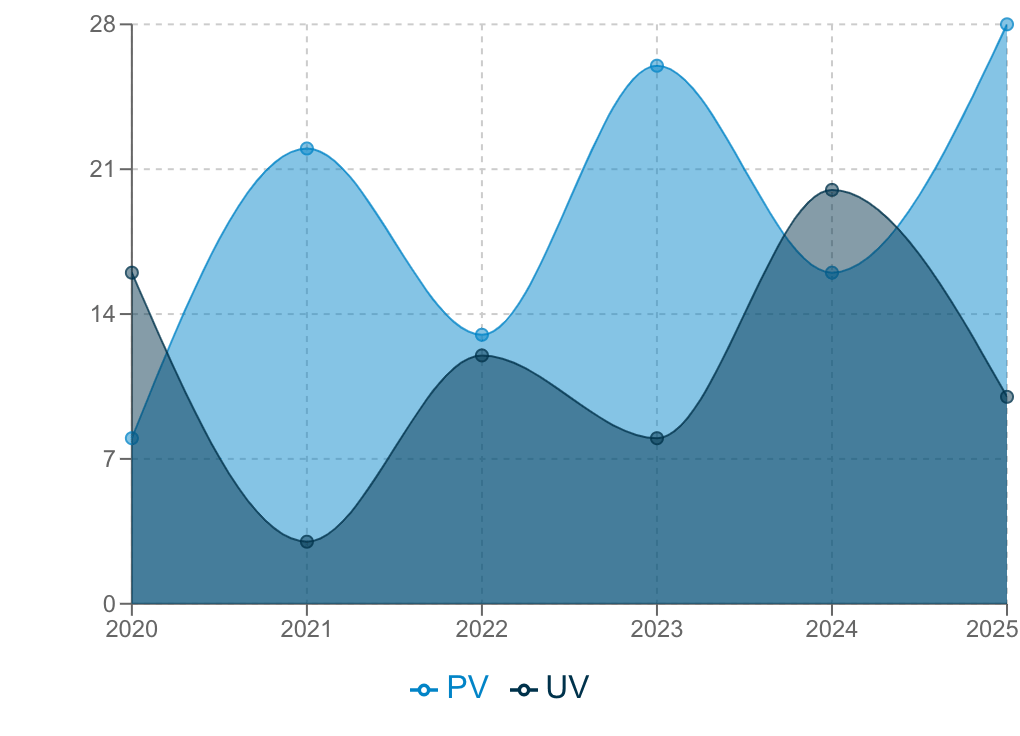
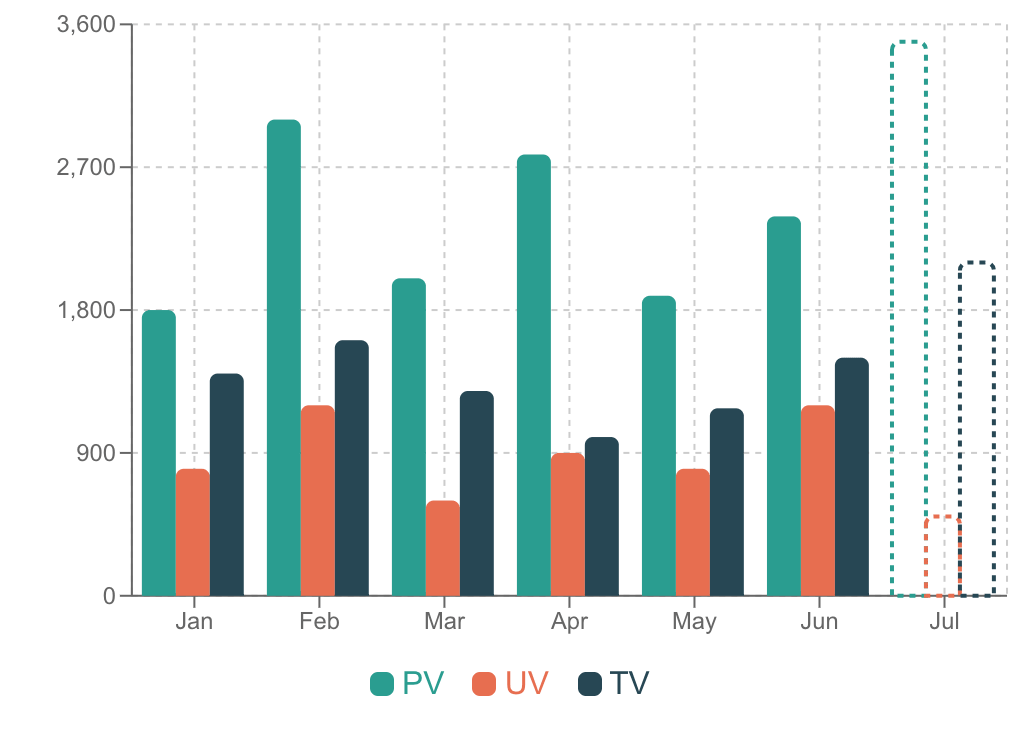
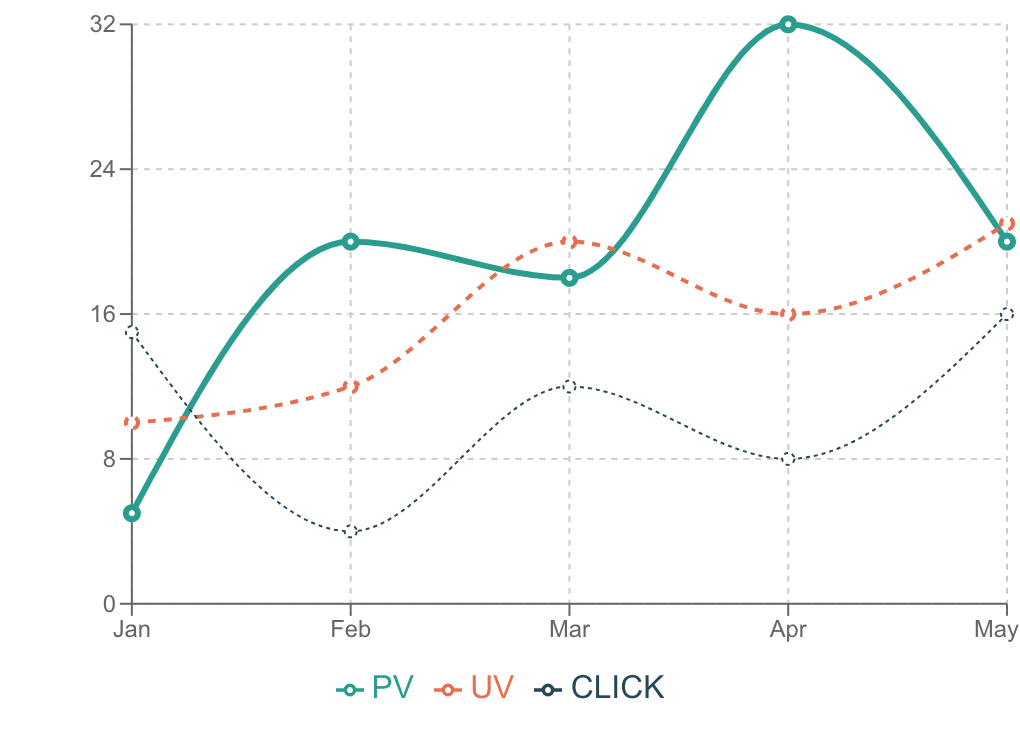
Time Series (11)
Show how data changes over time
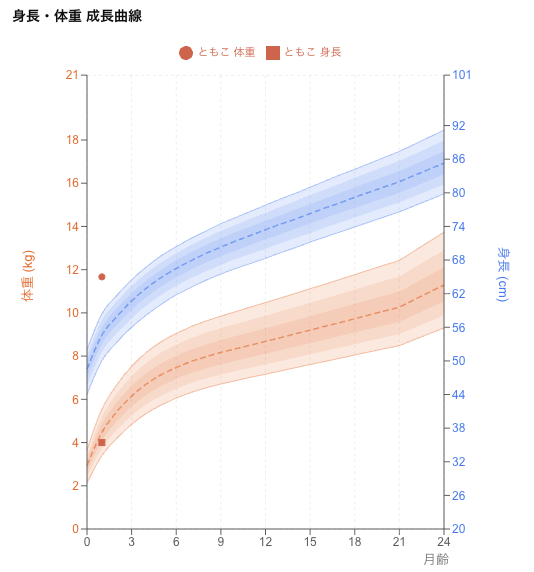
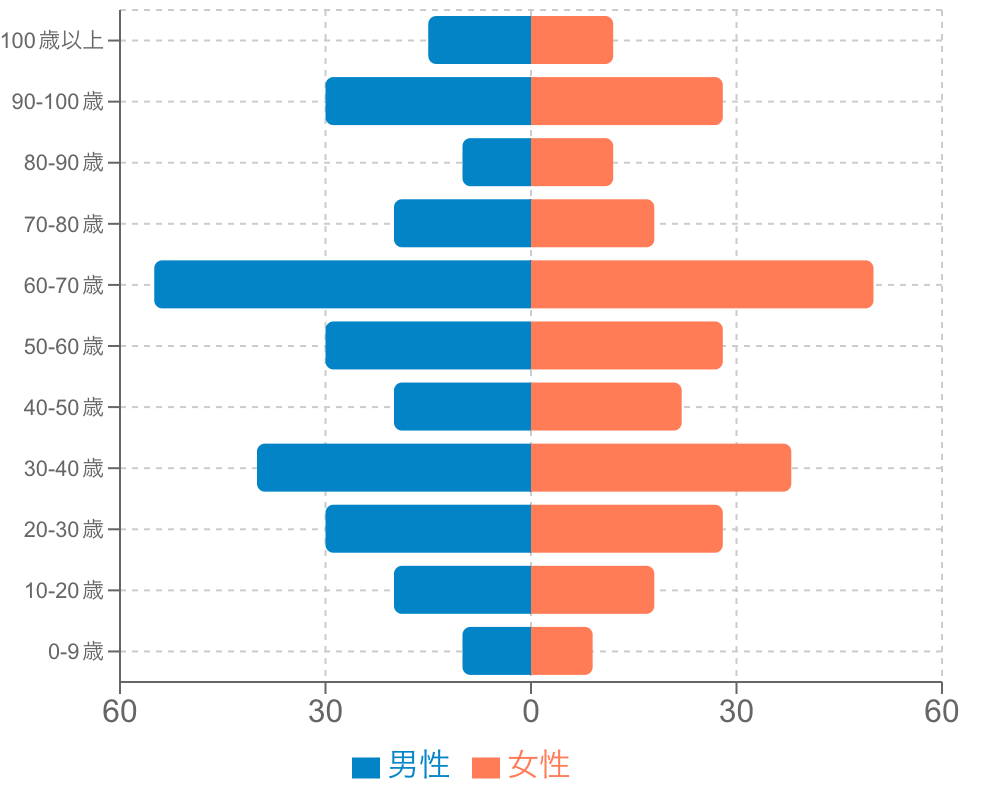
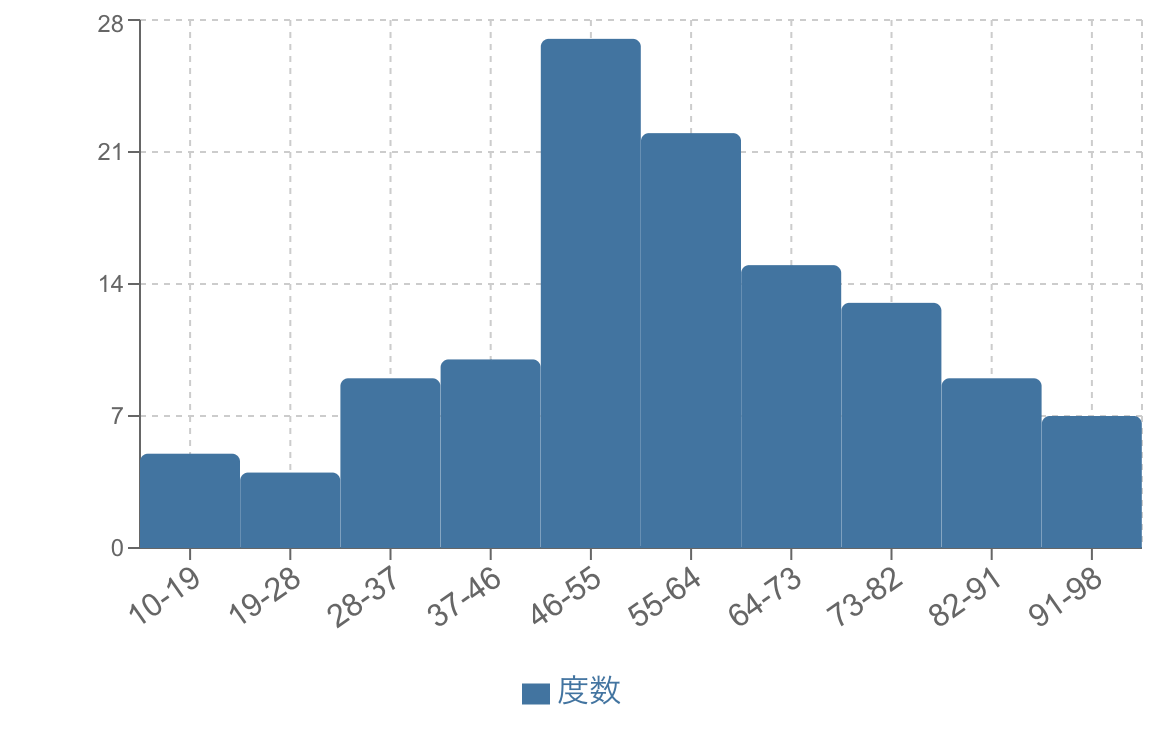
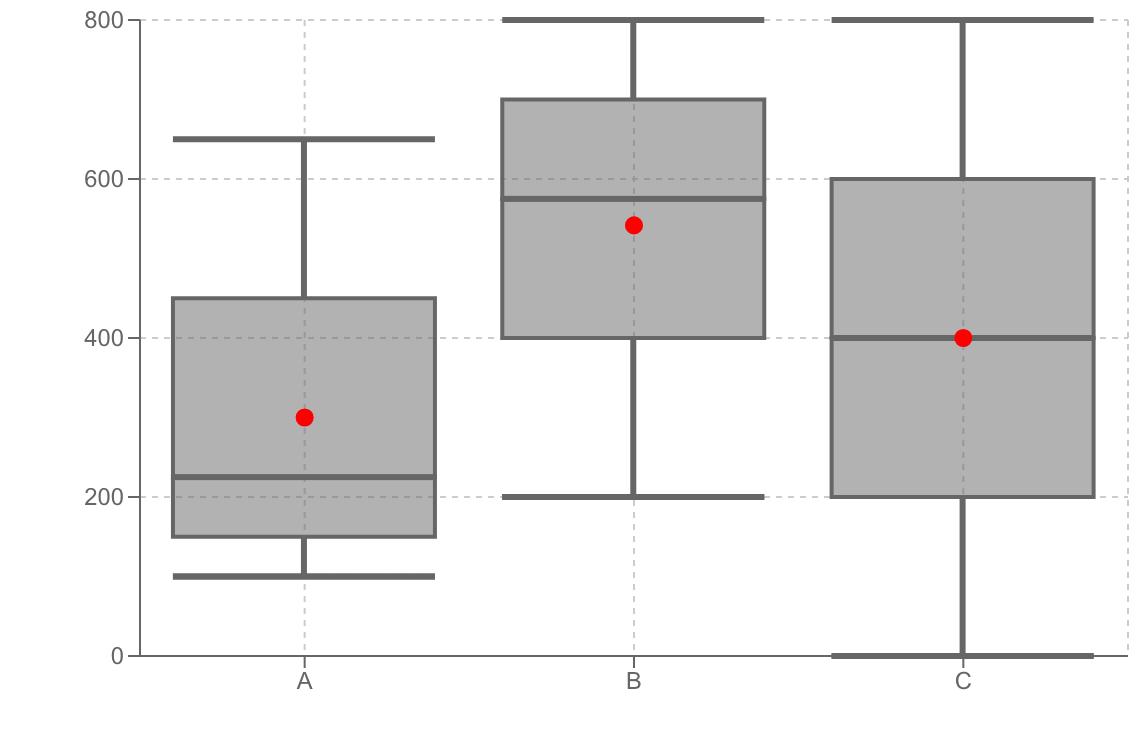
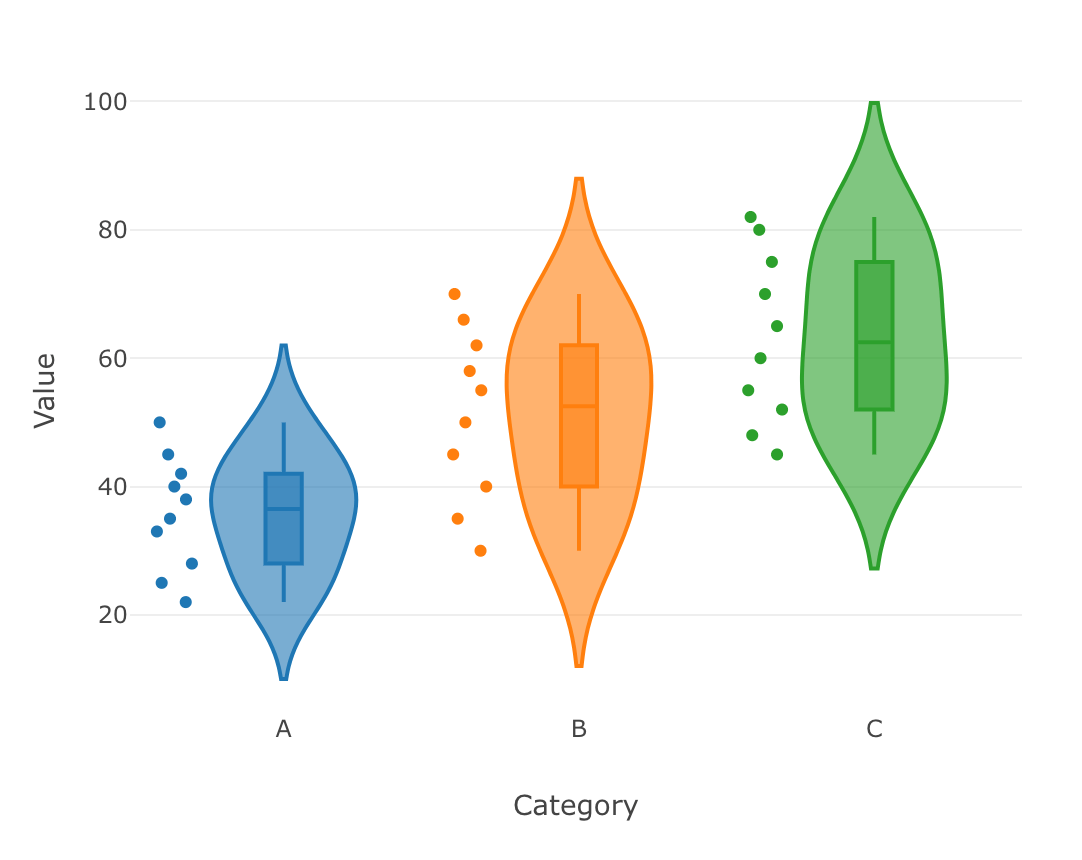
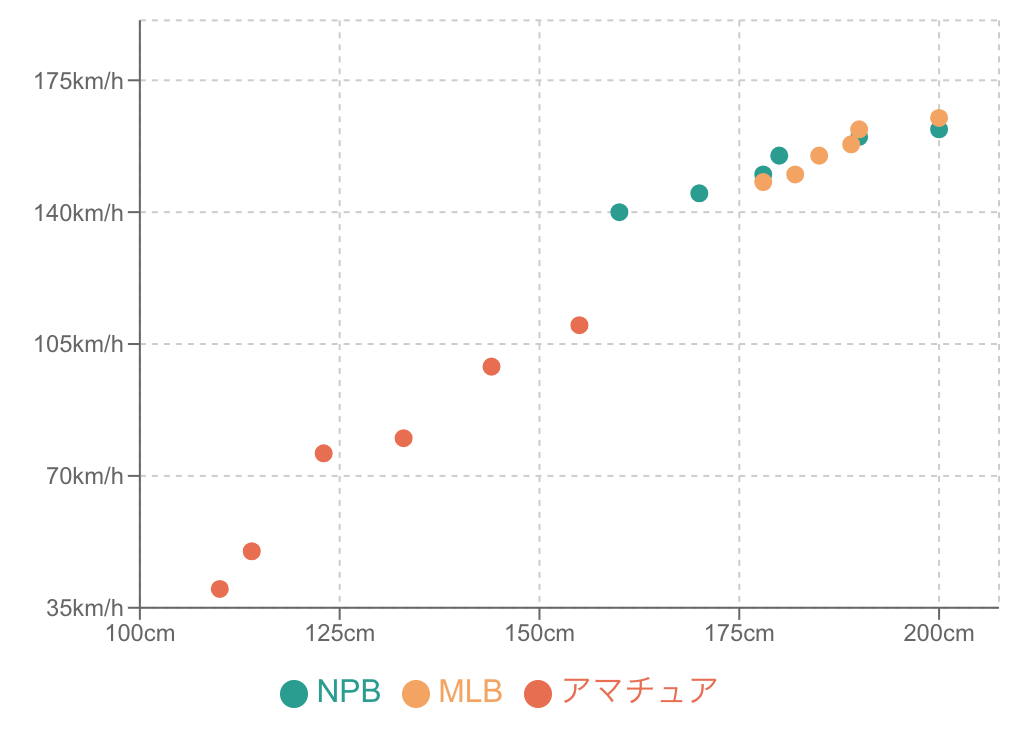
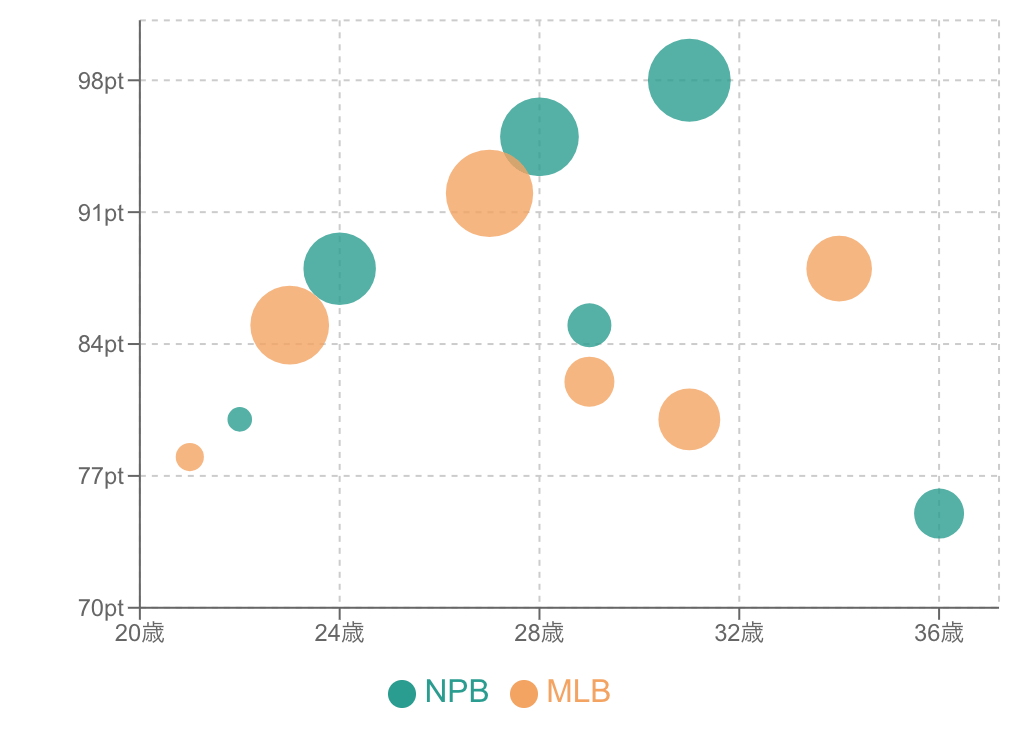
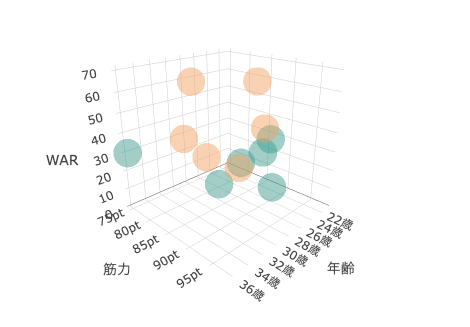
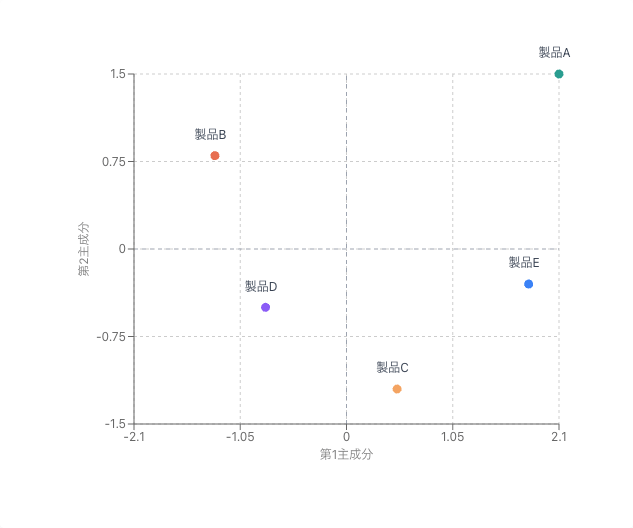
Distribution & Correlation (7)
Show the spread, trends, and correlations in data
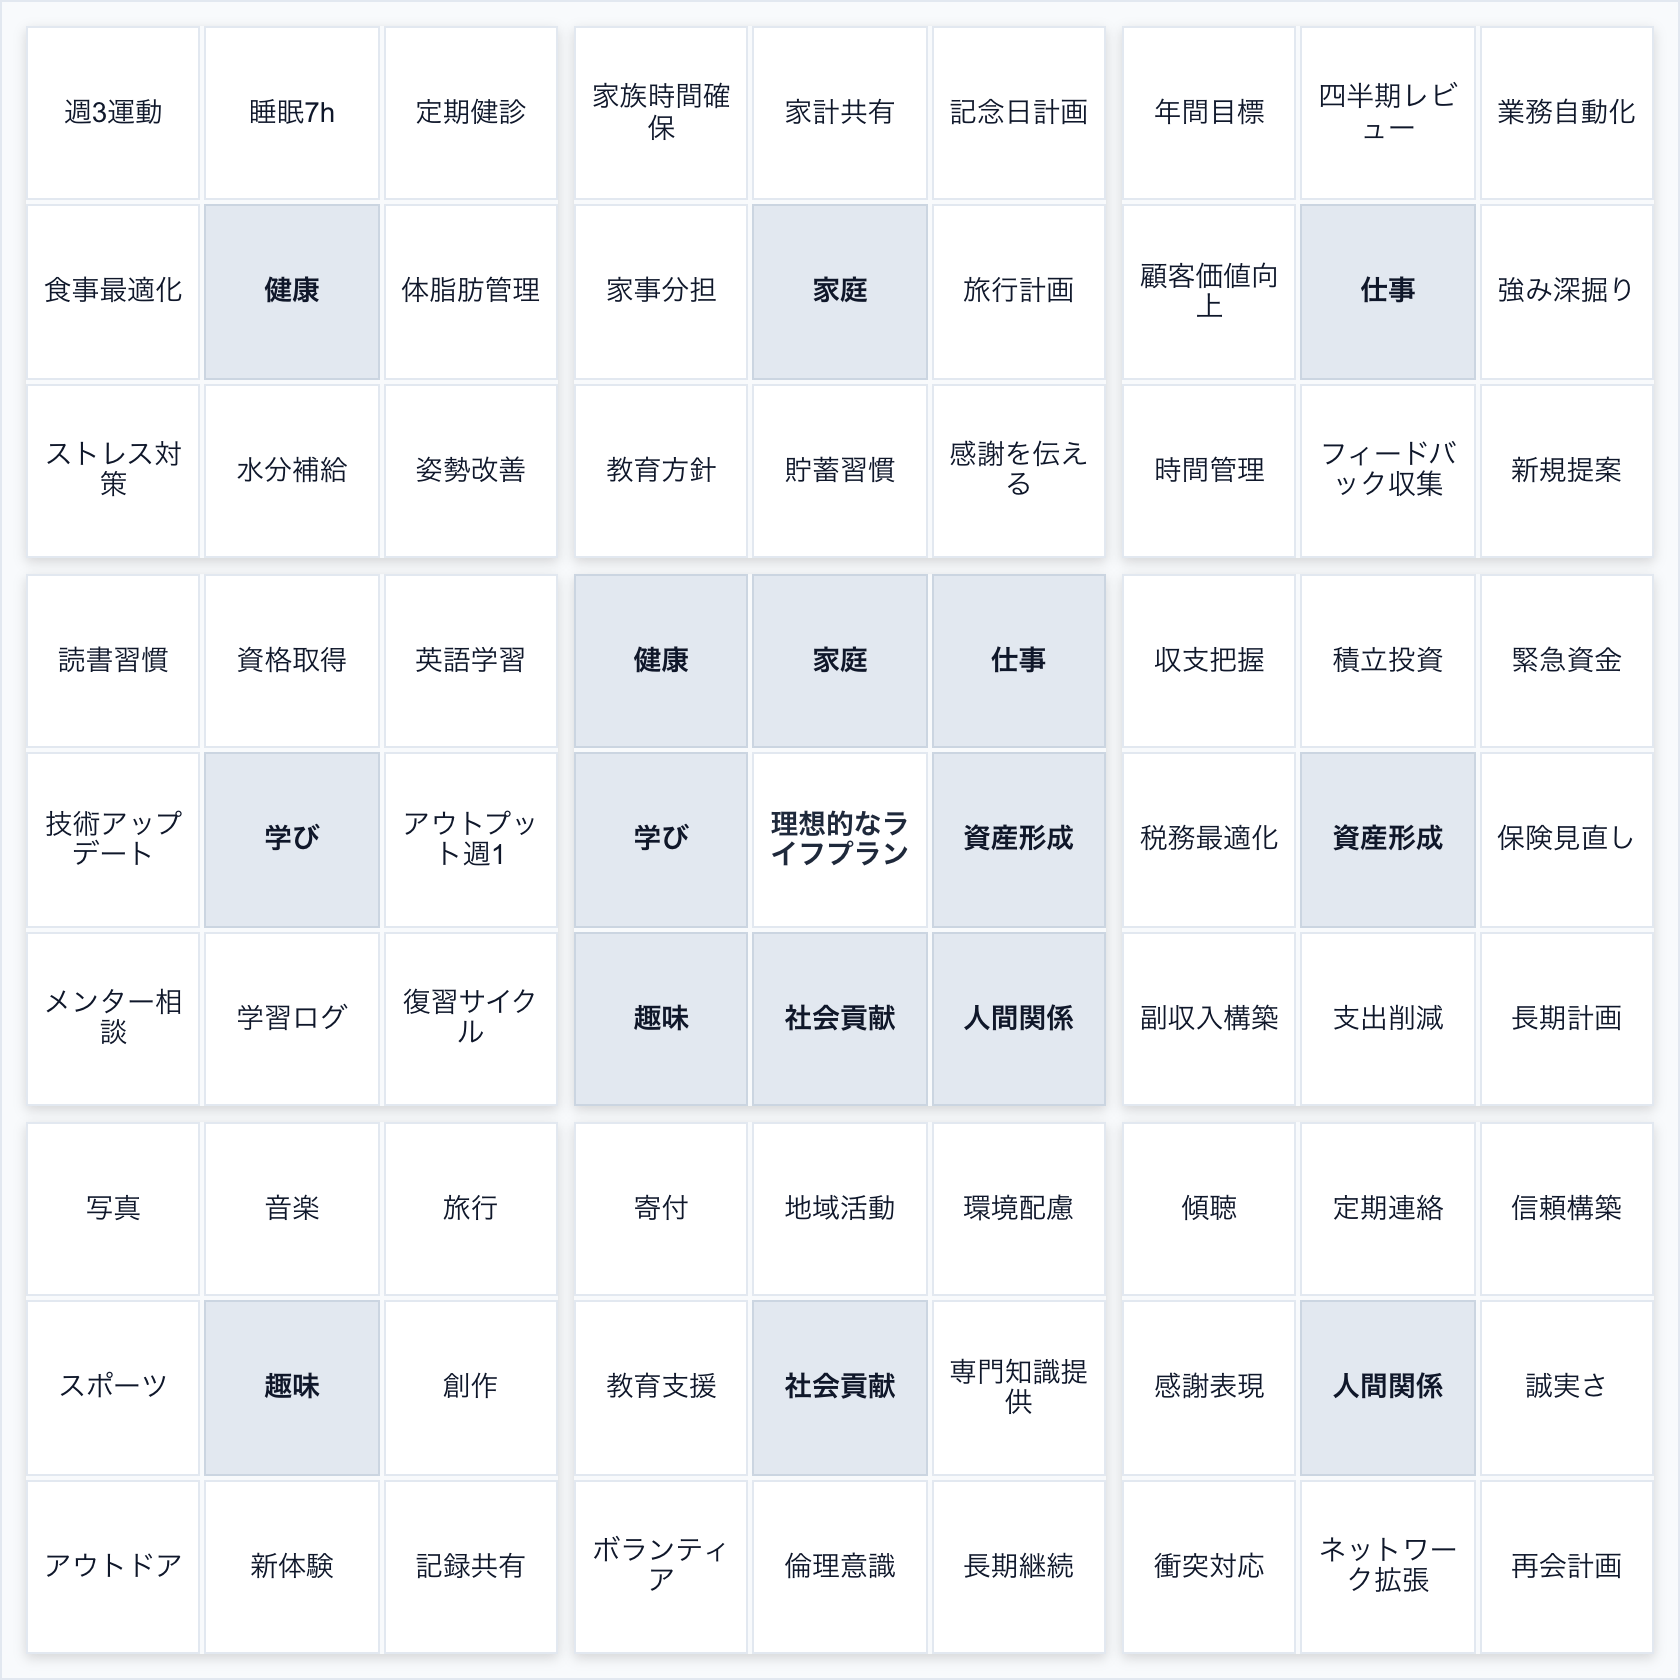
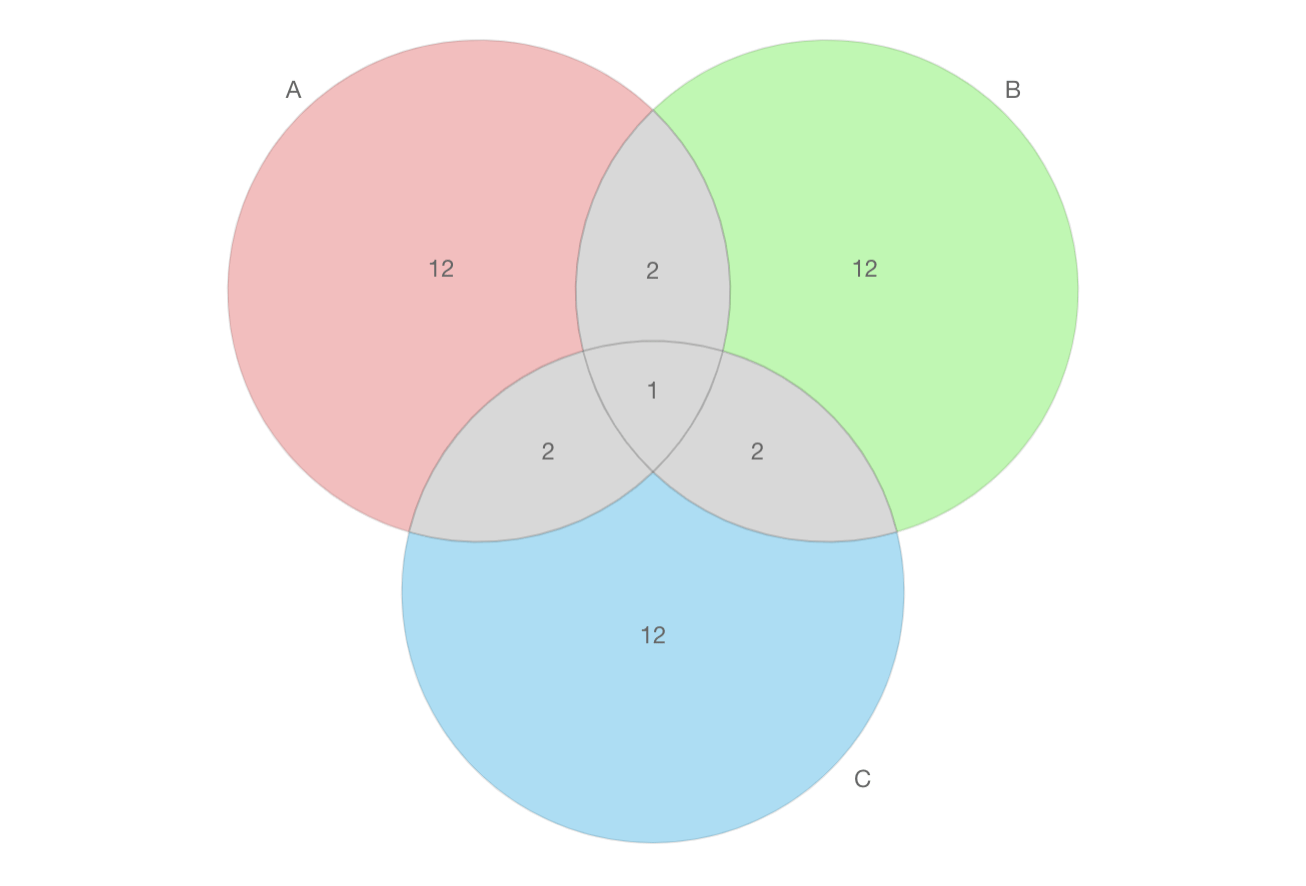
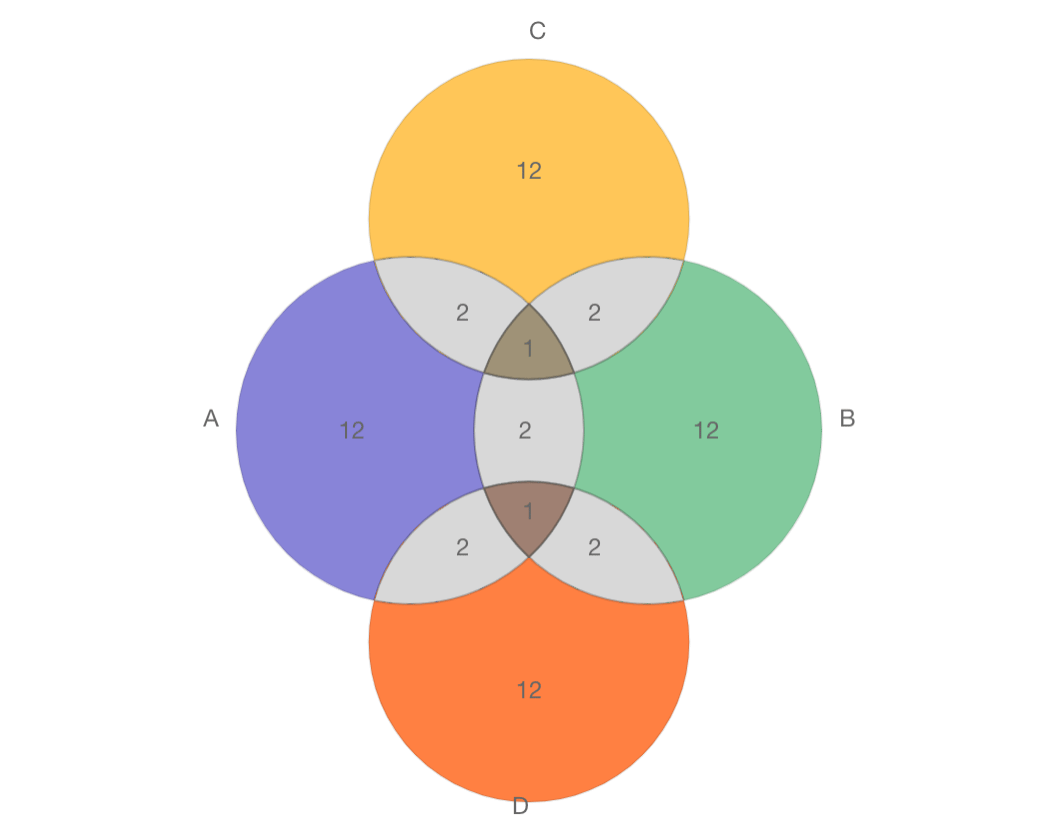
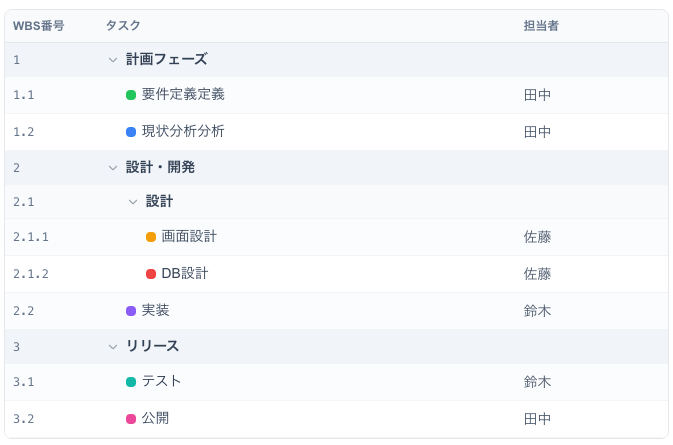
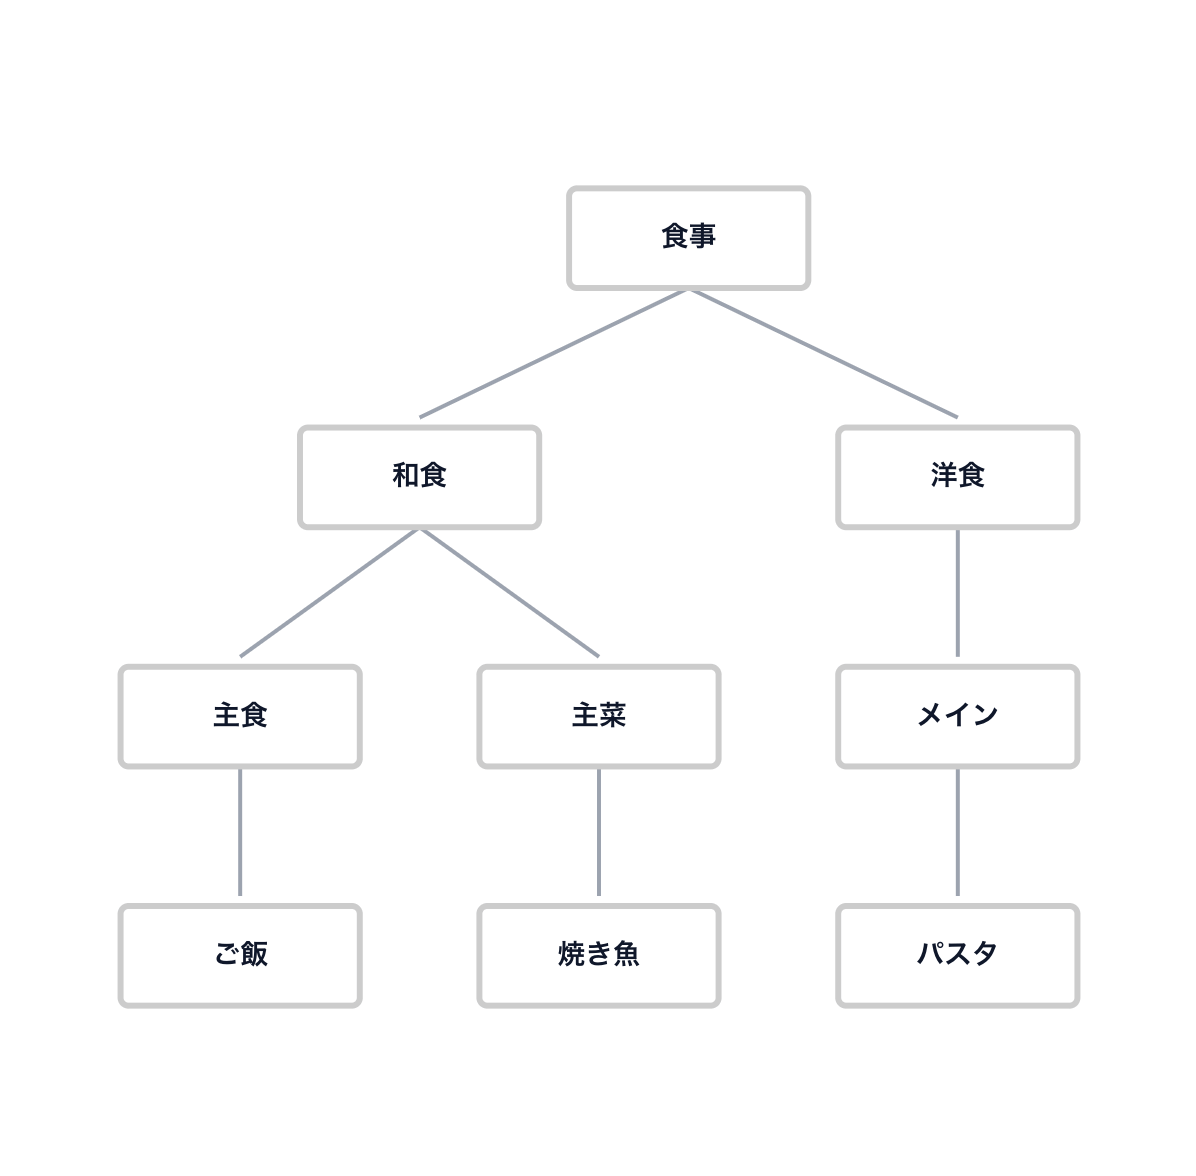
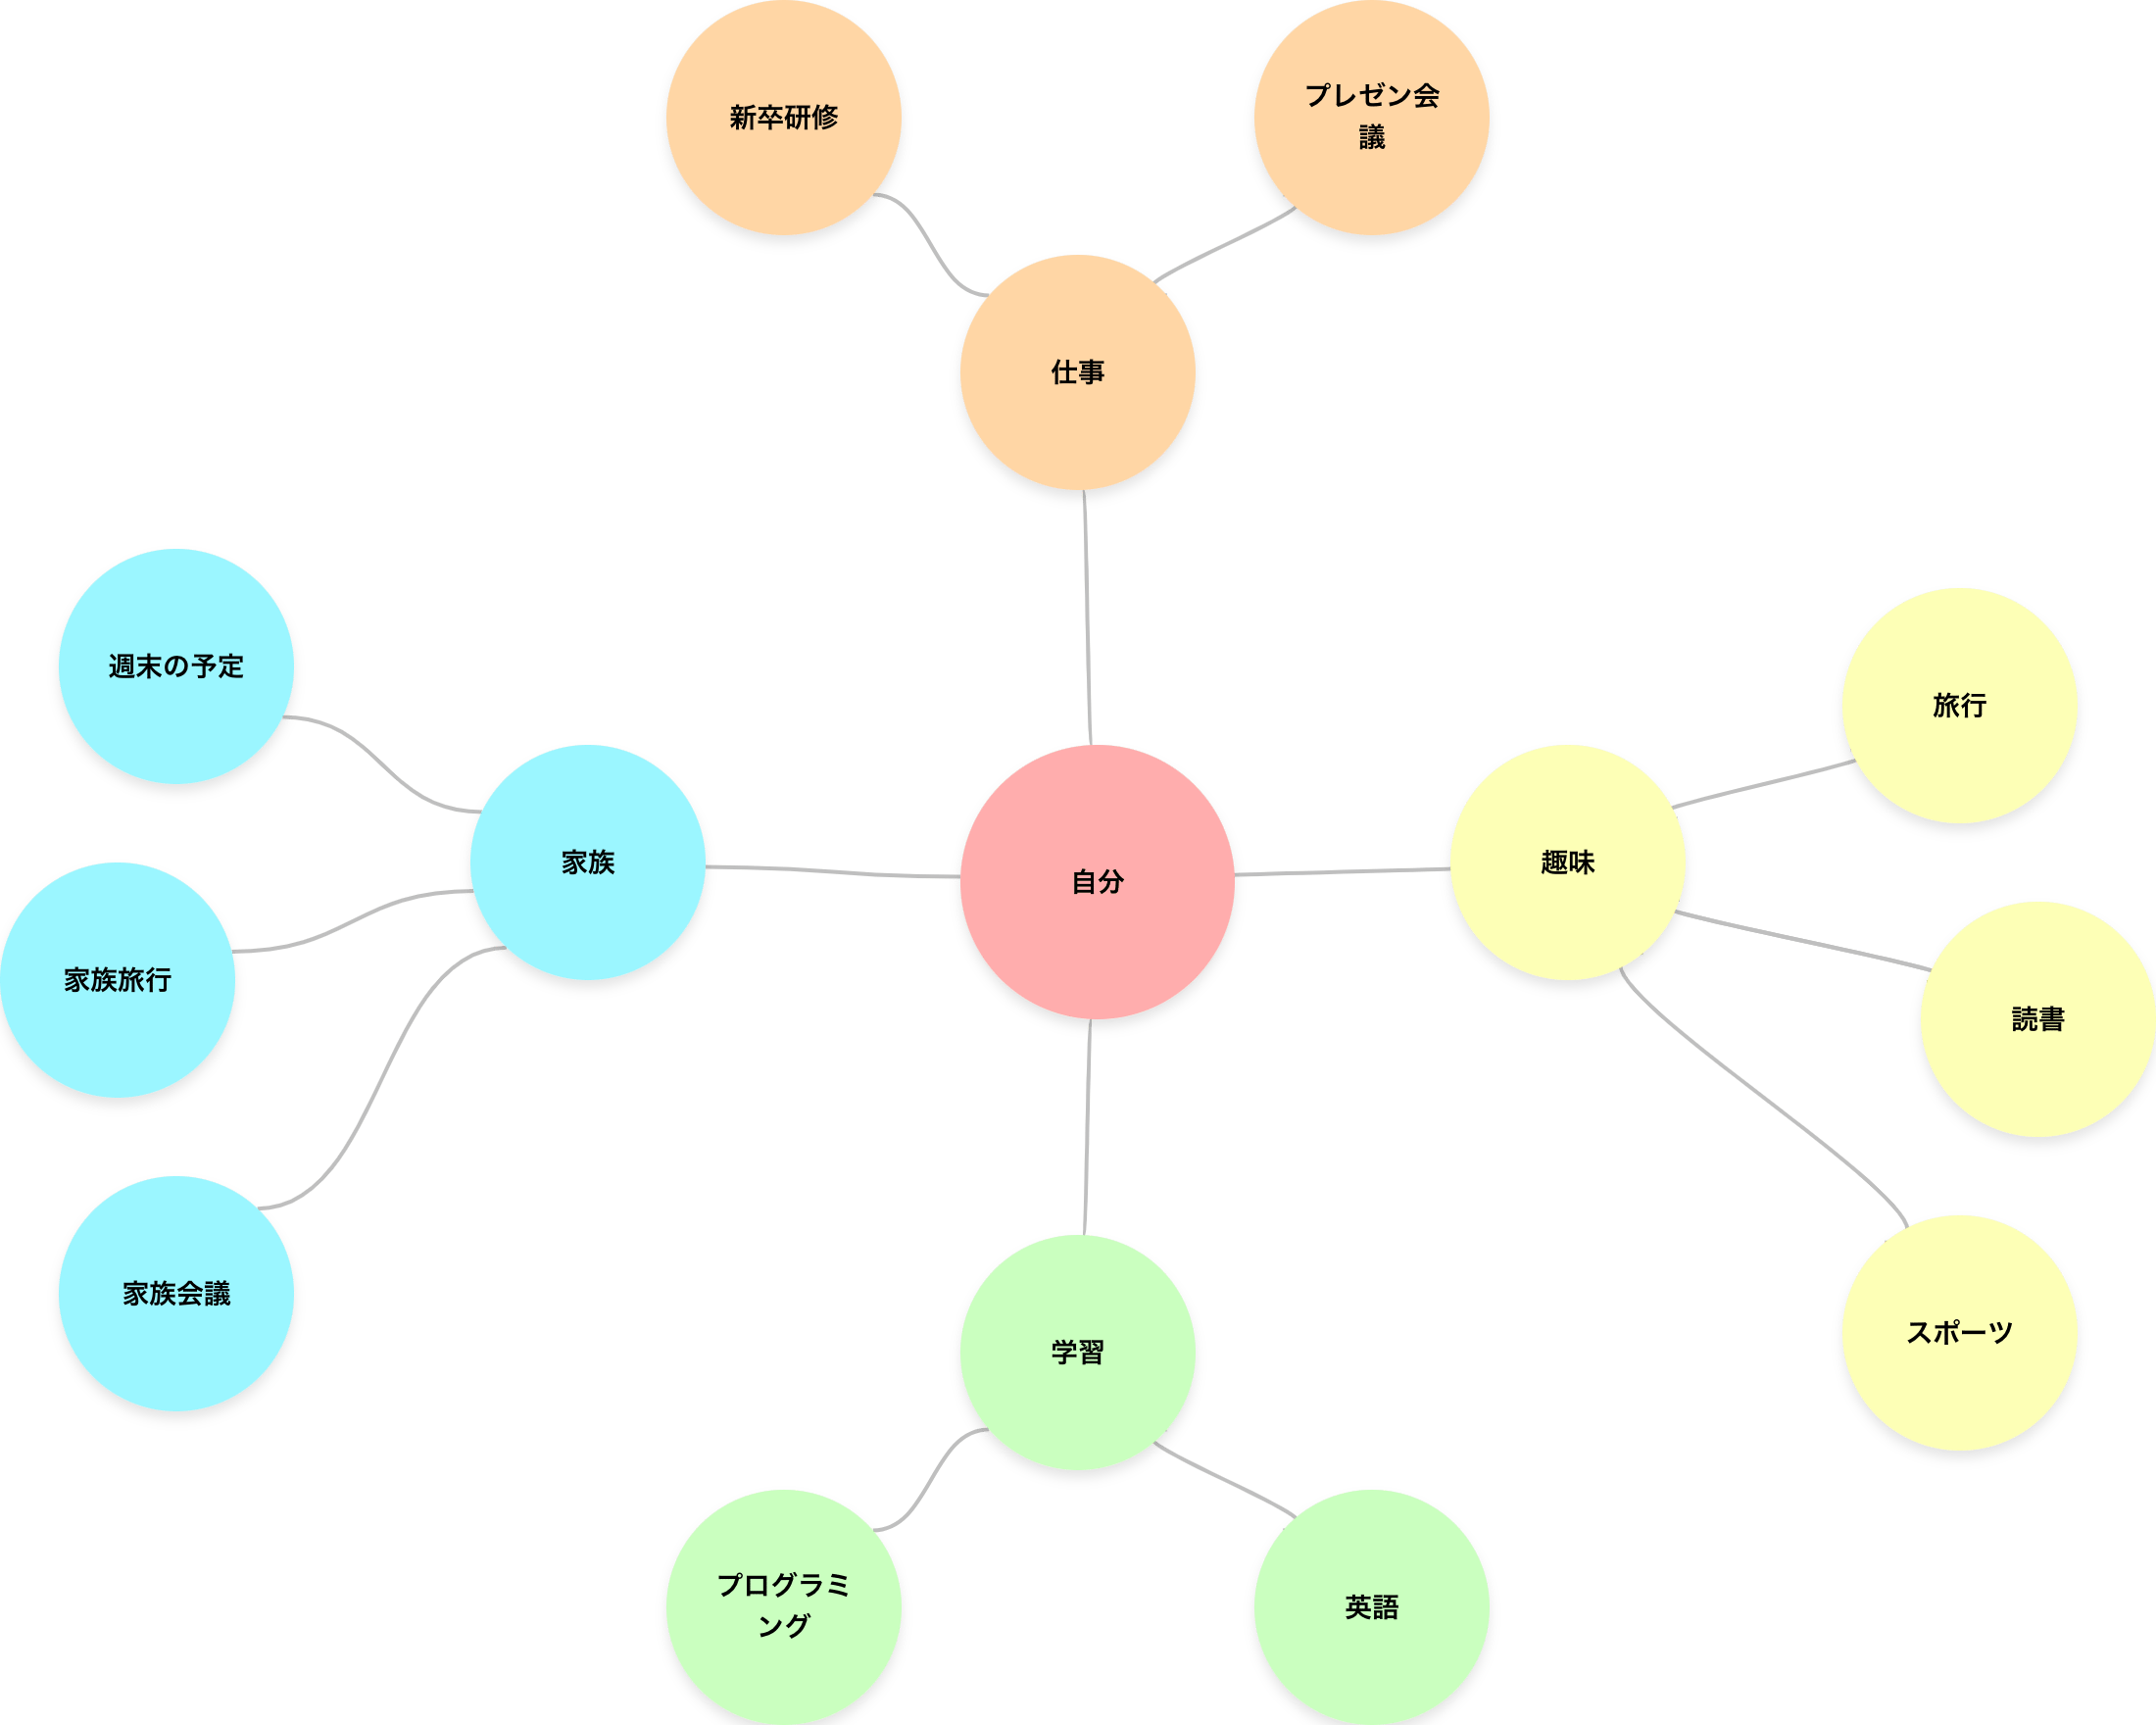
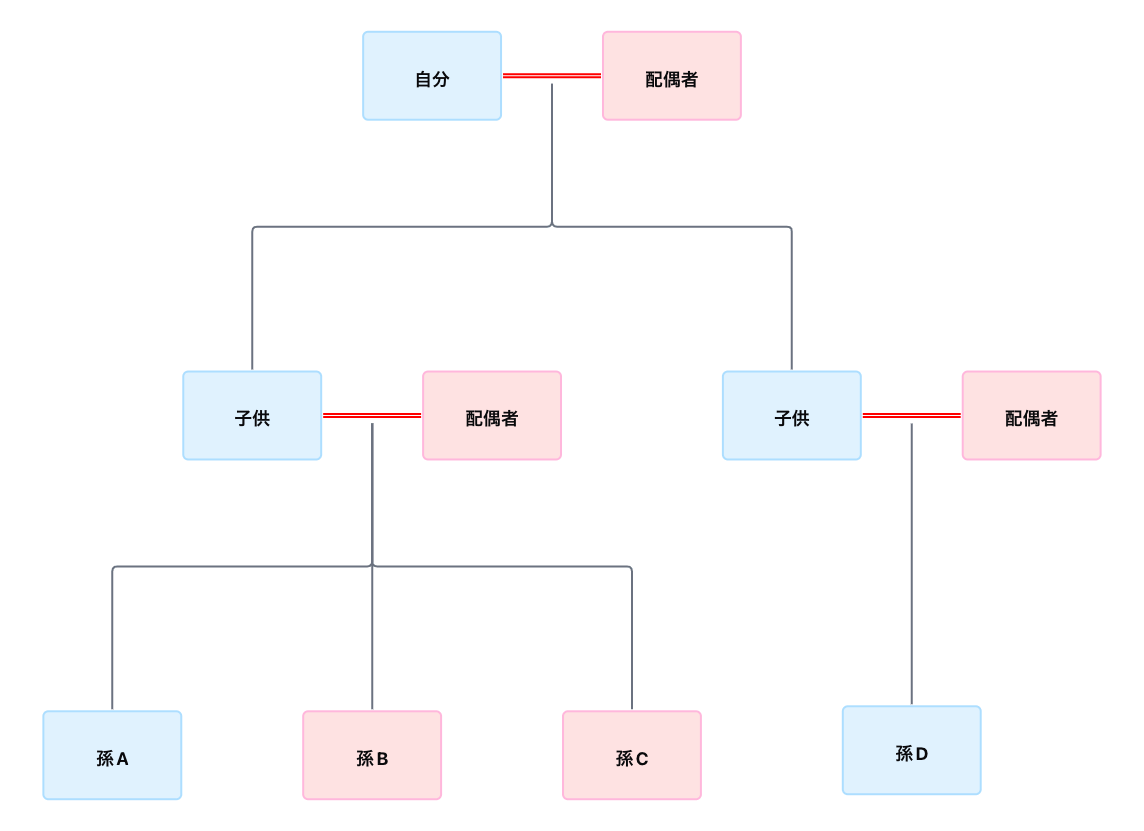
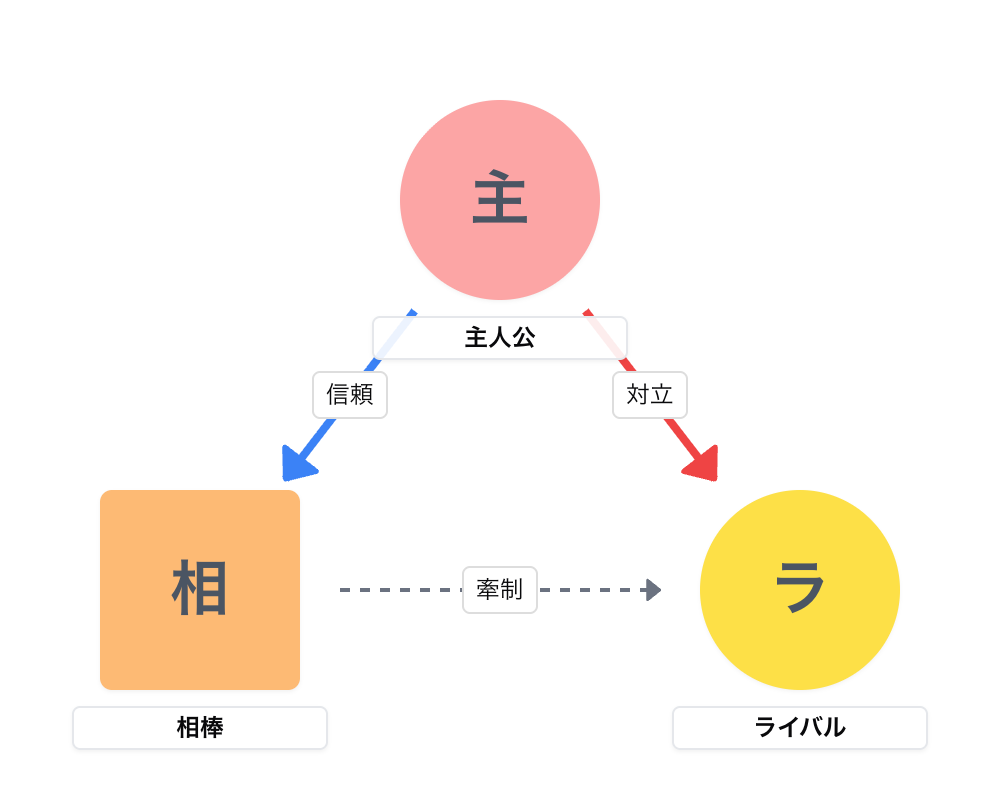
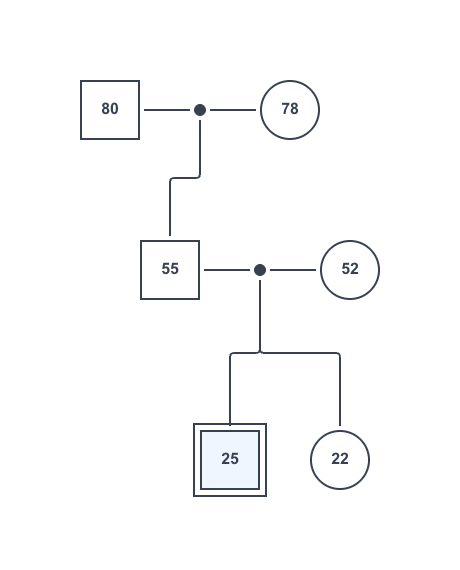
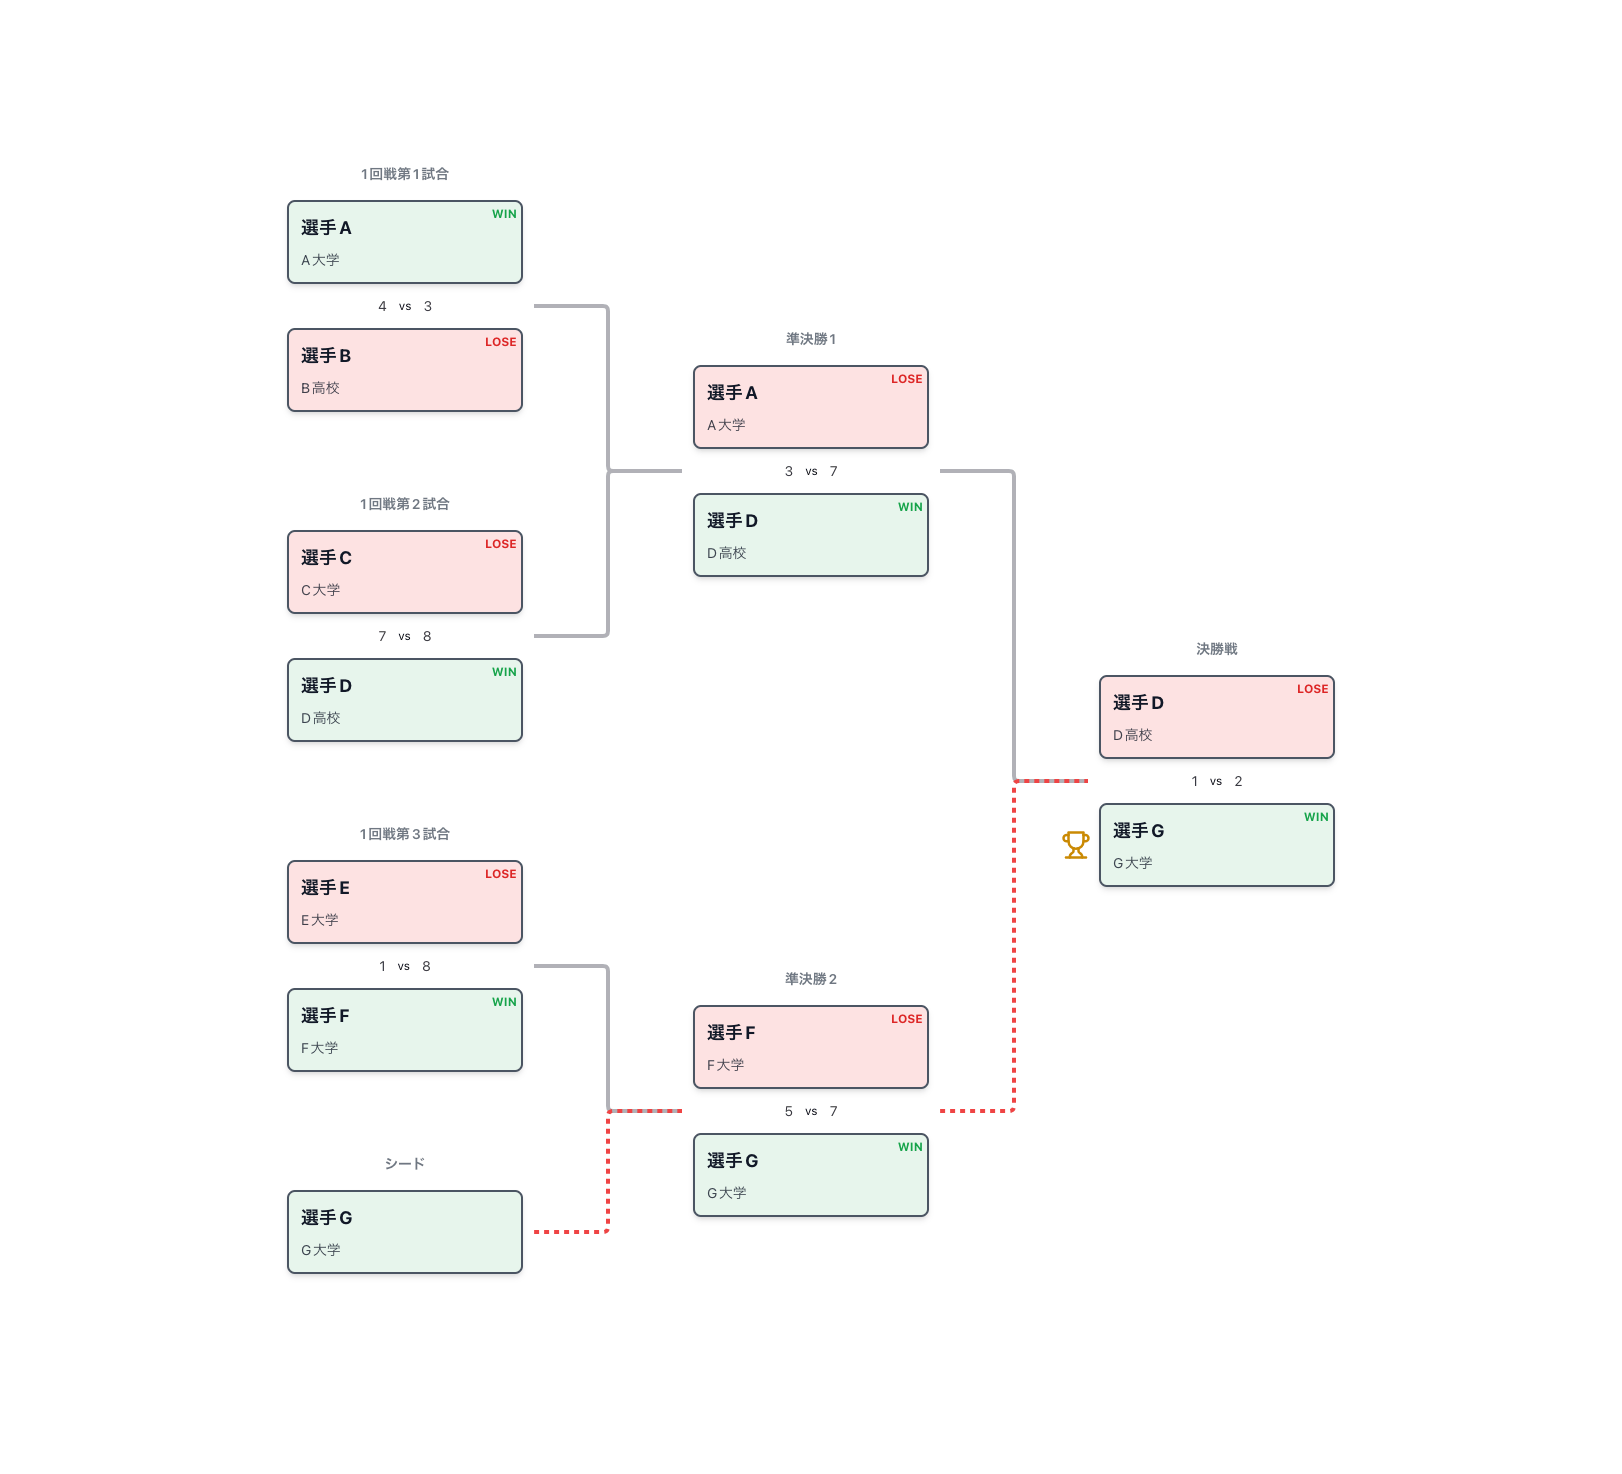
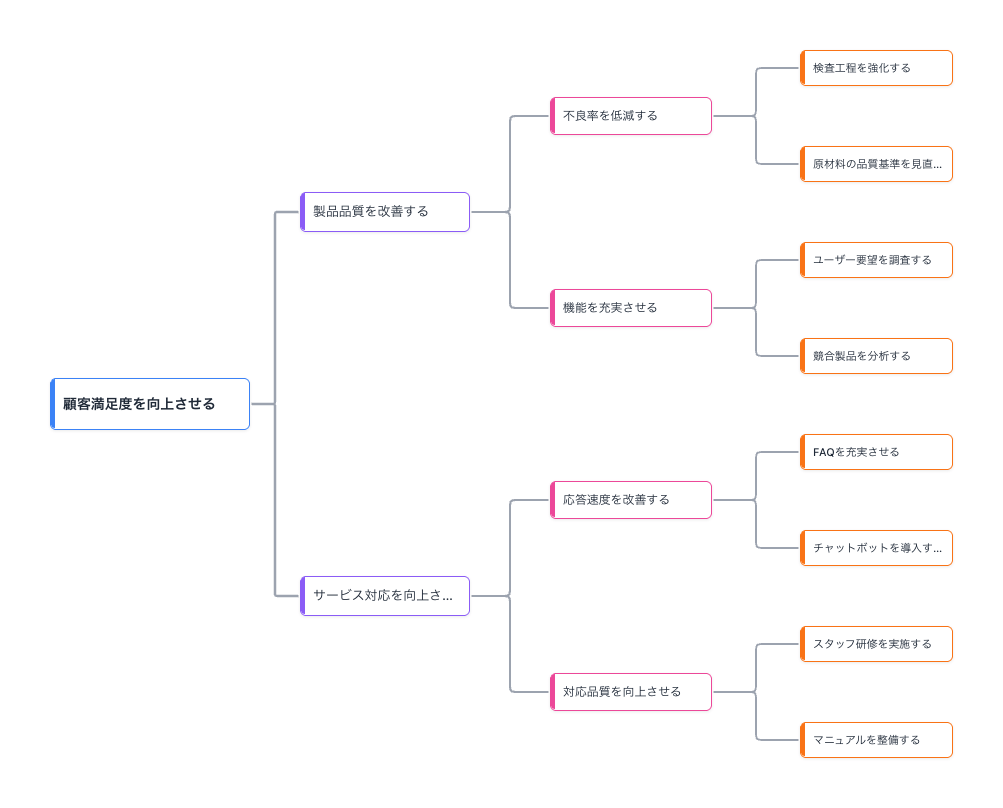
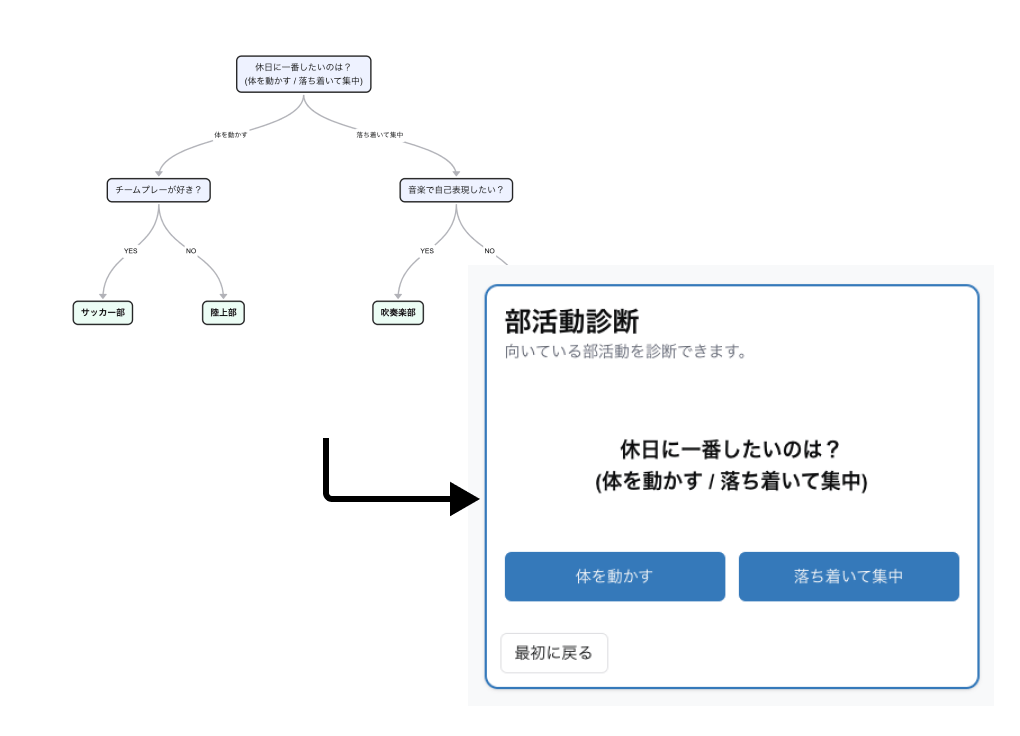
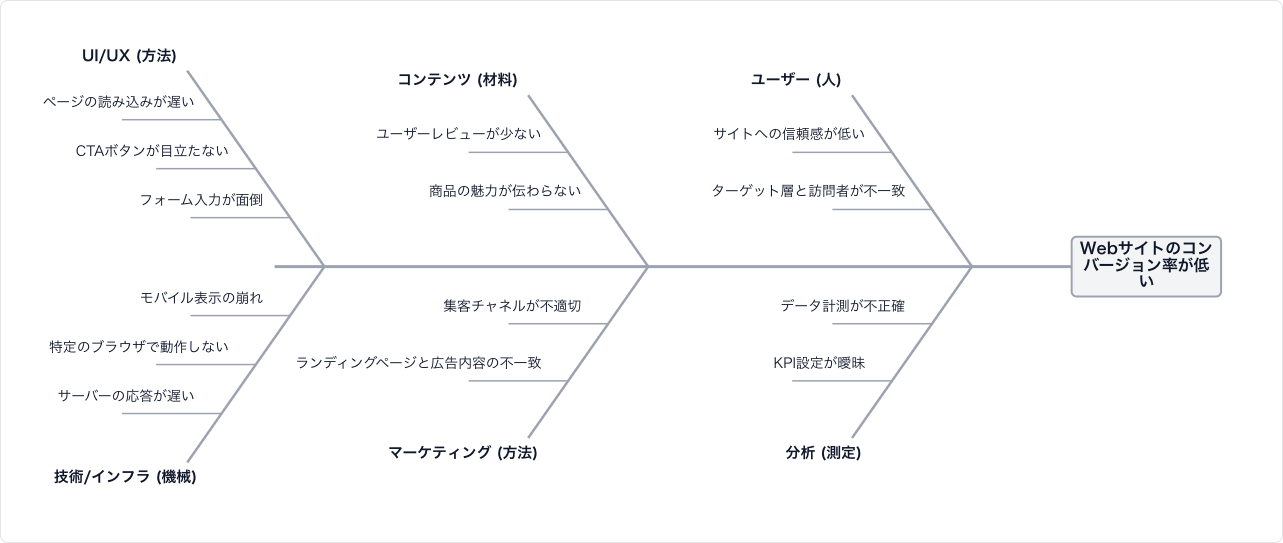
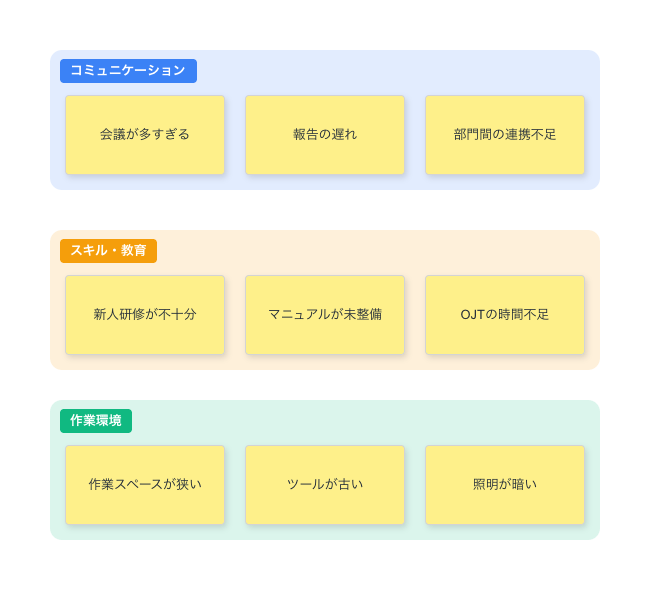
Hierarchy & Relationships (11)
Show hierarchical structures and relationships among data

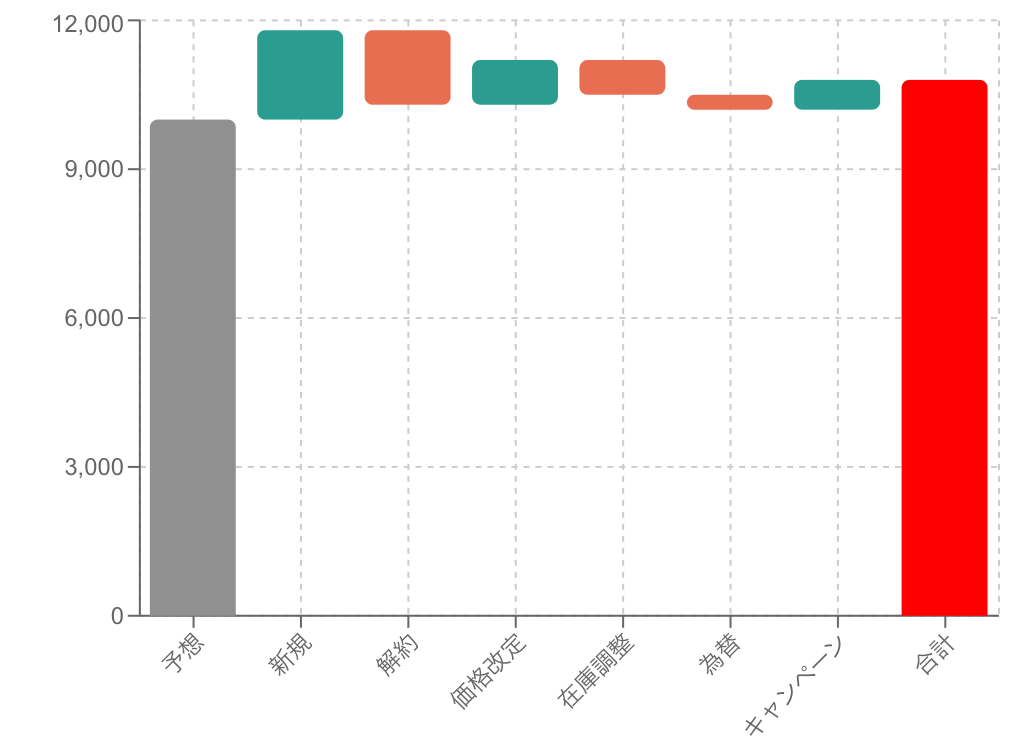
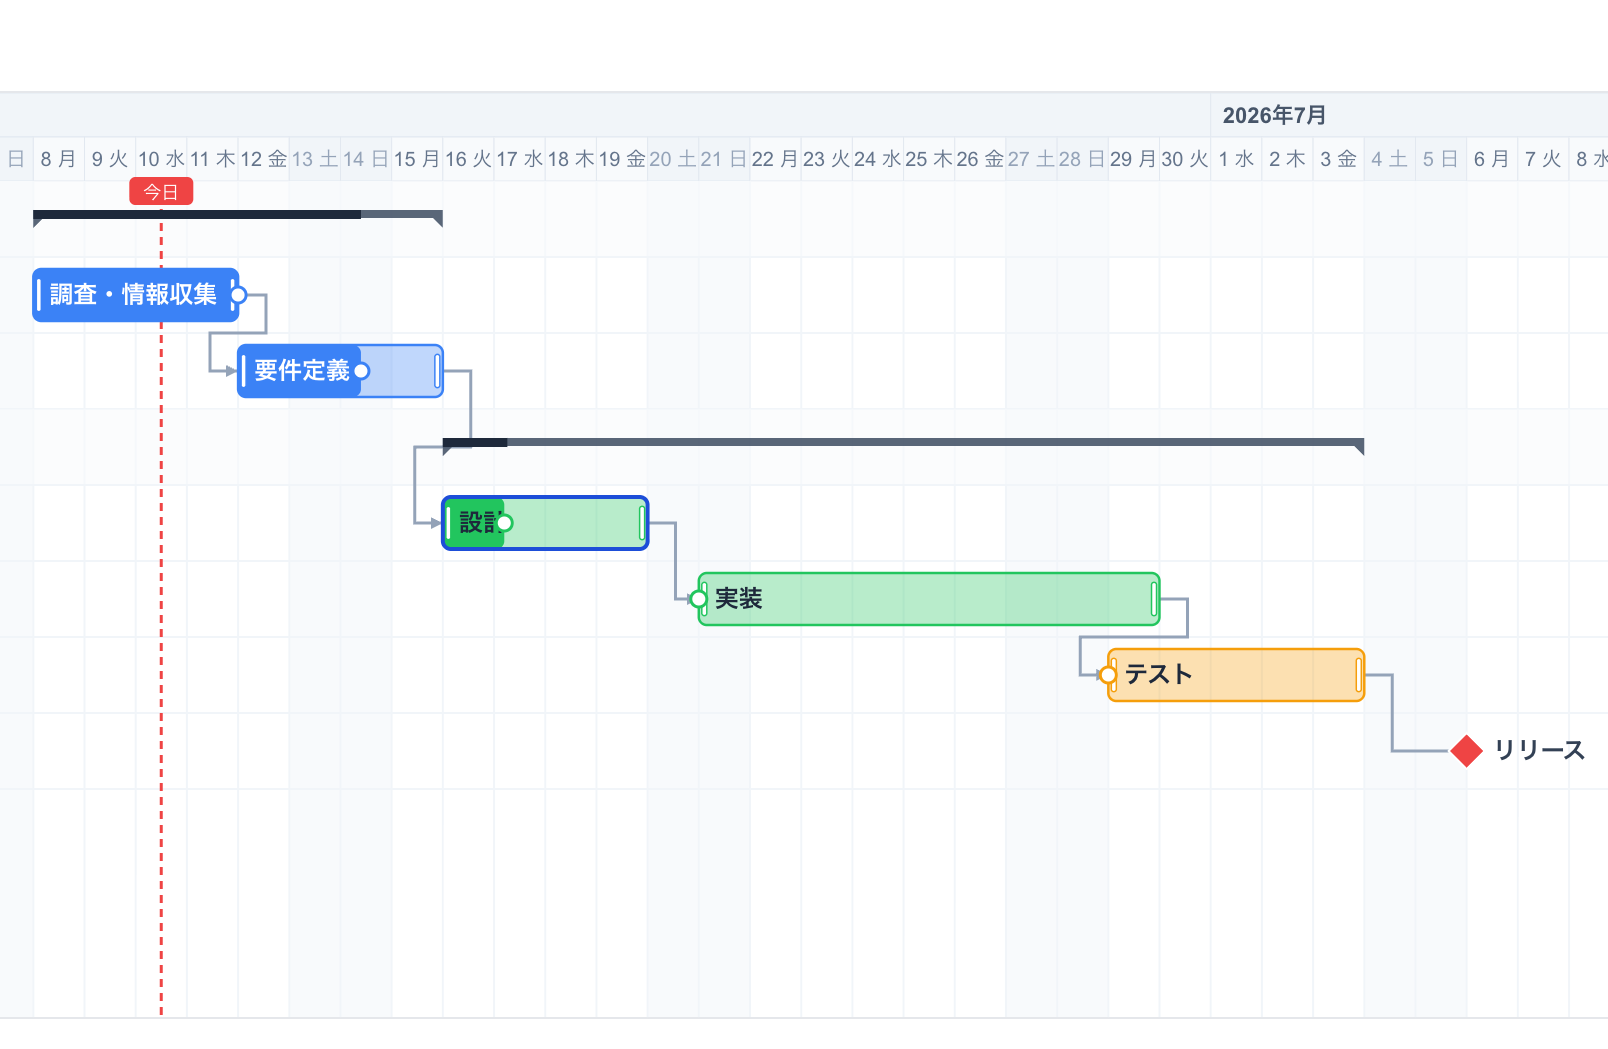
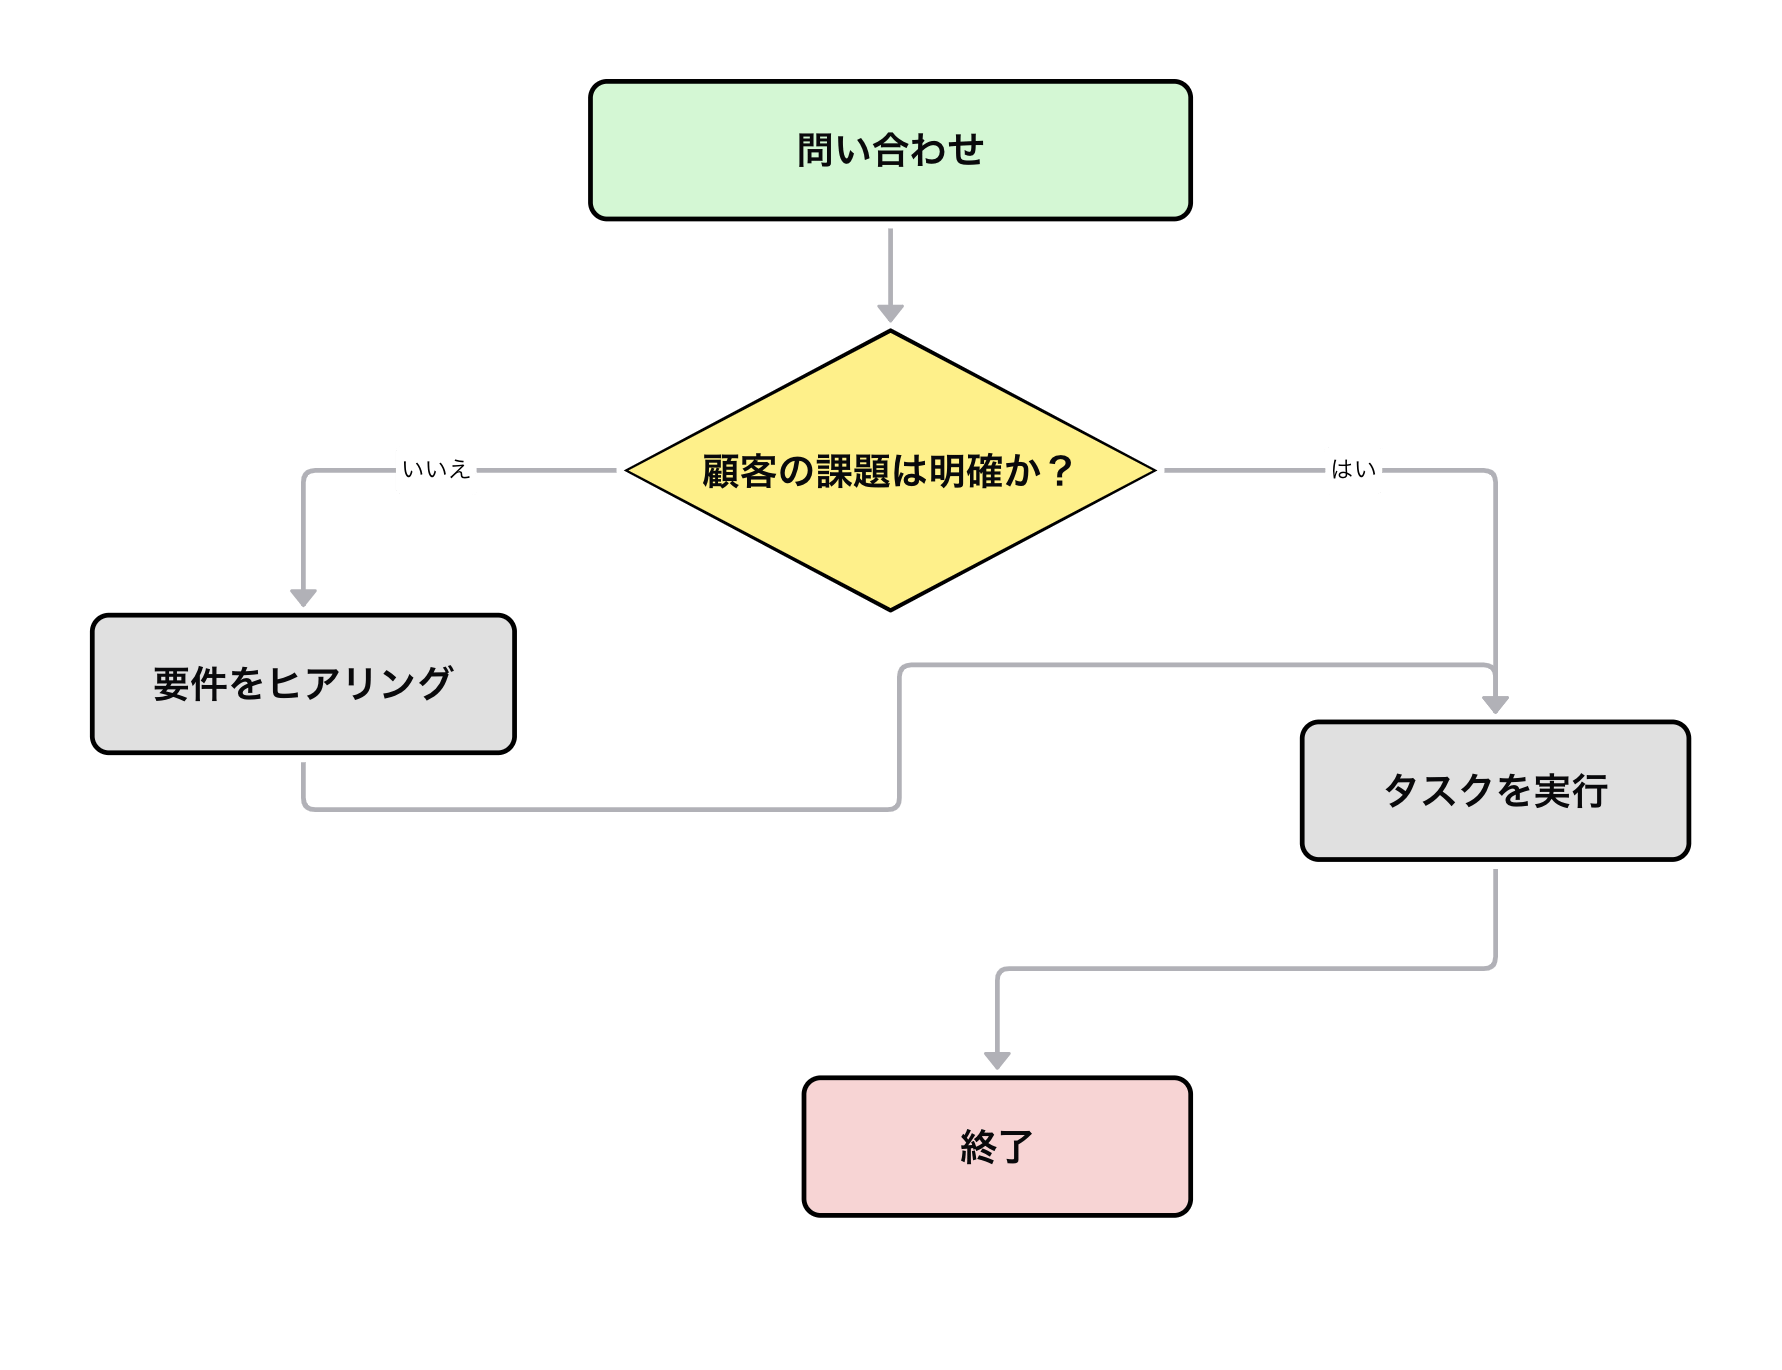
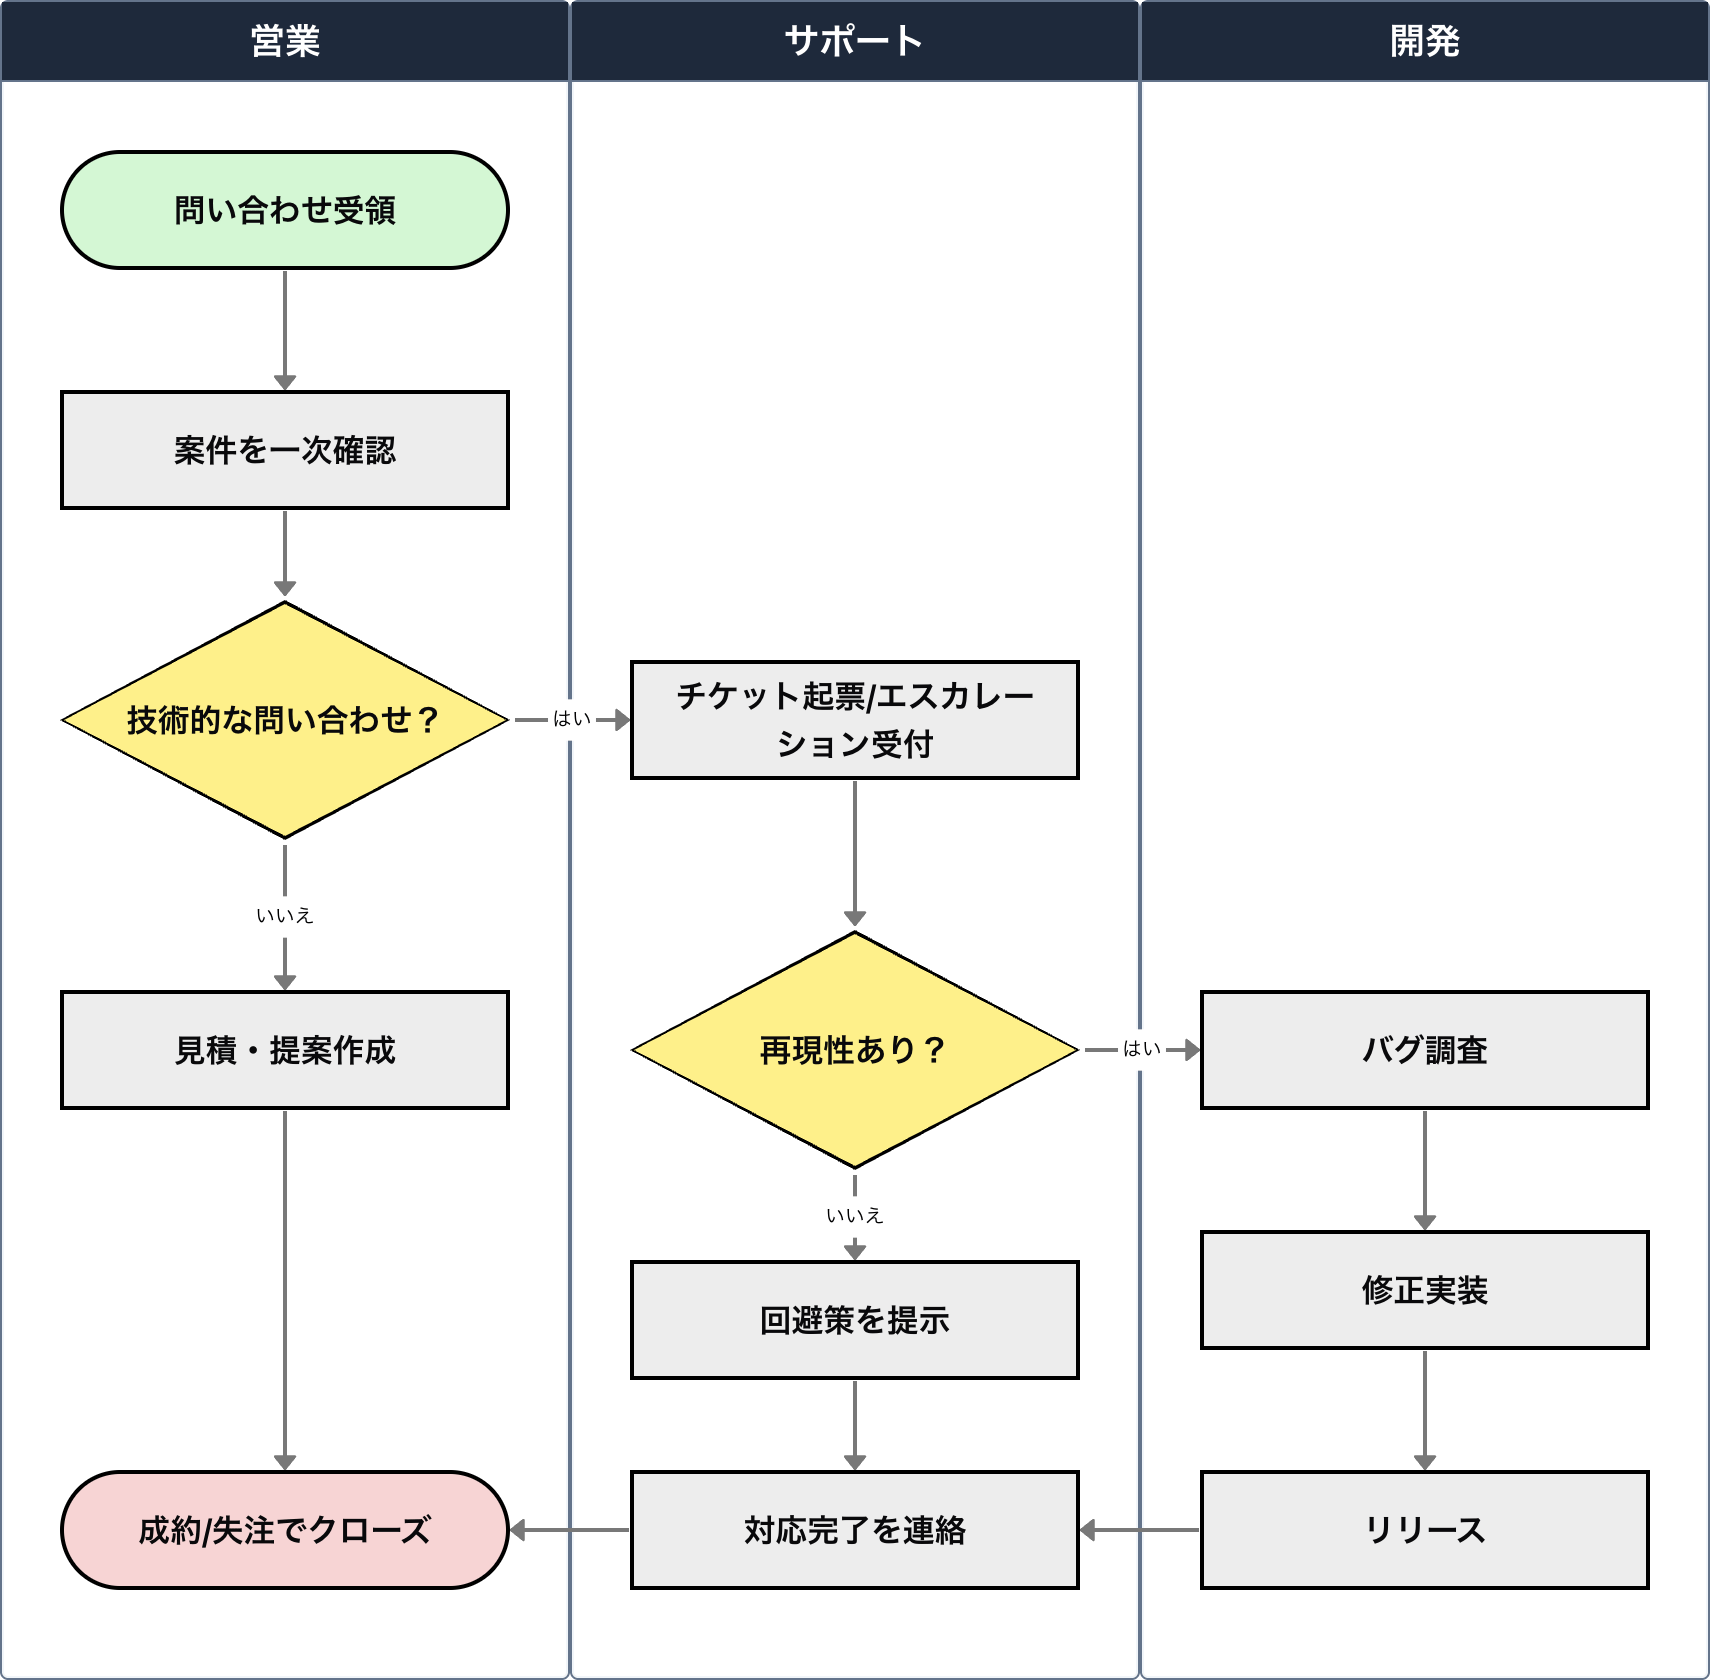
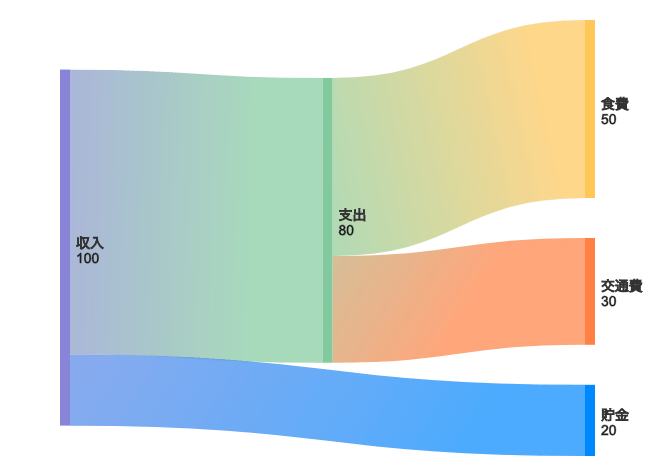
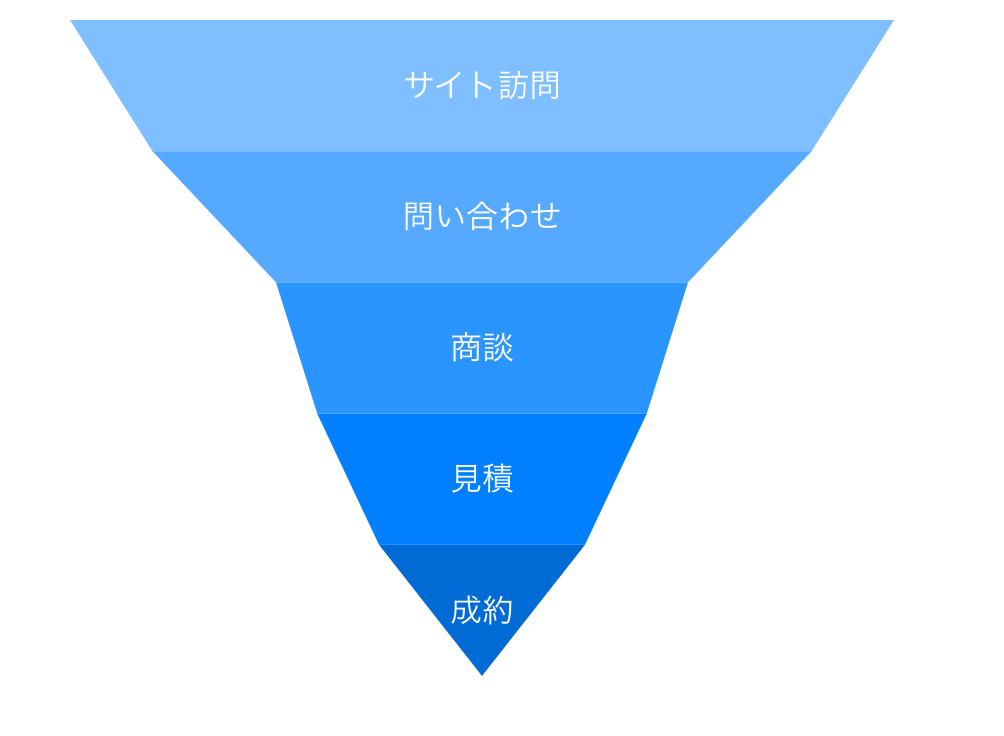
Flow (11)
Show the flow or change of data and processes
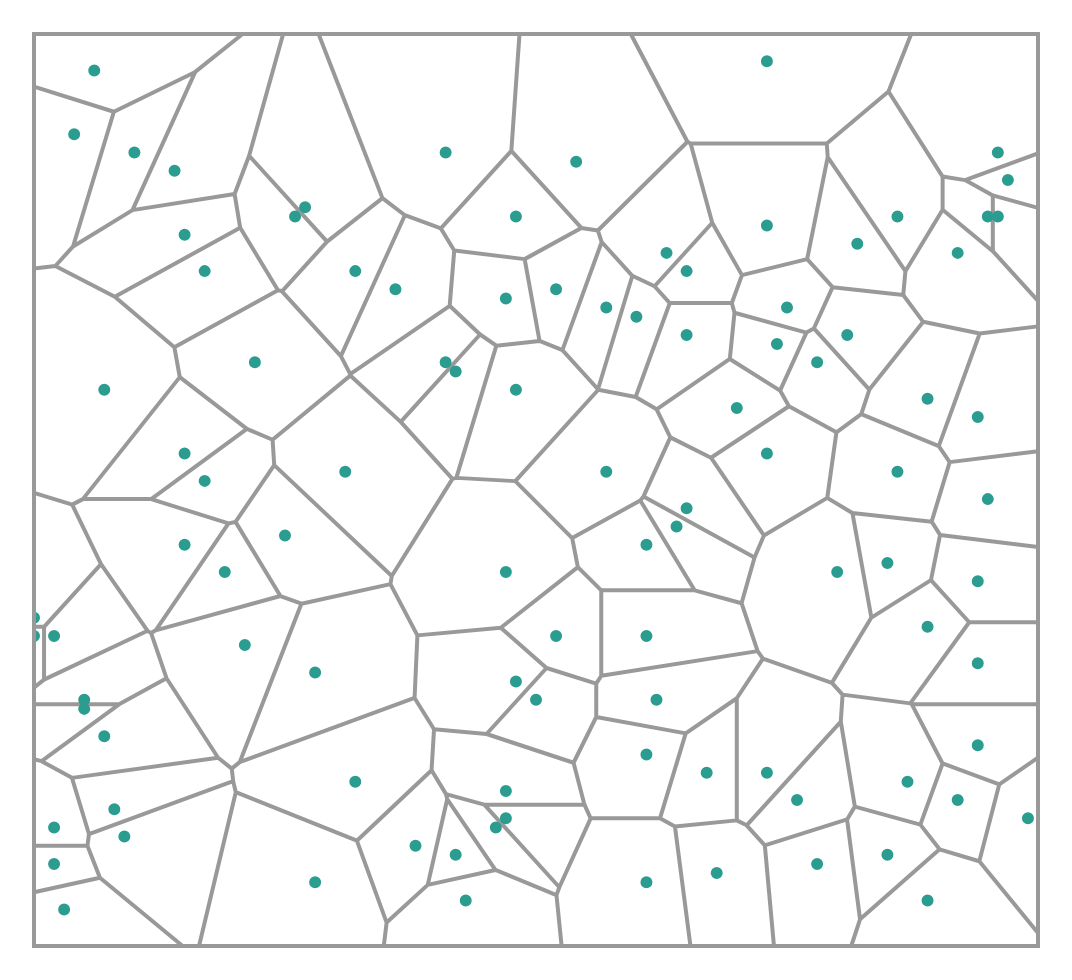
Spatial & Shapes (3)
Show geographic distribution and spatial relationships
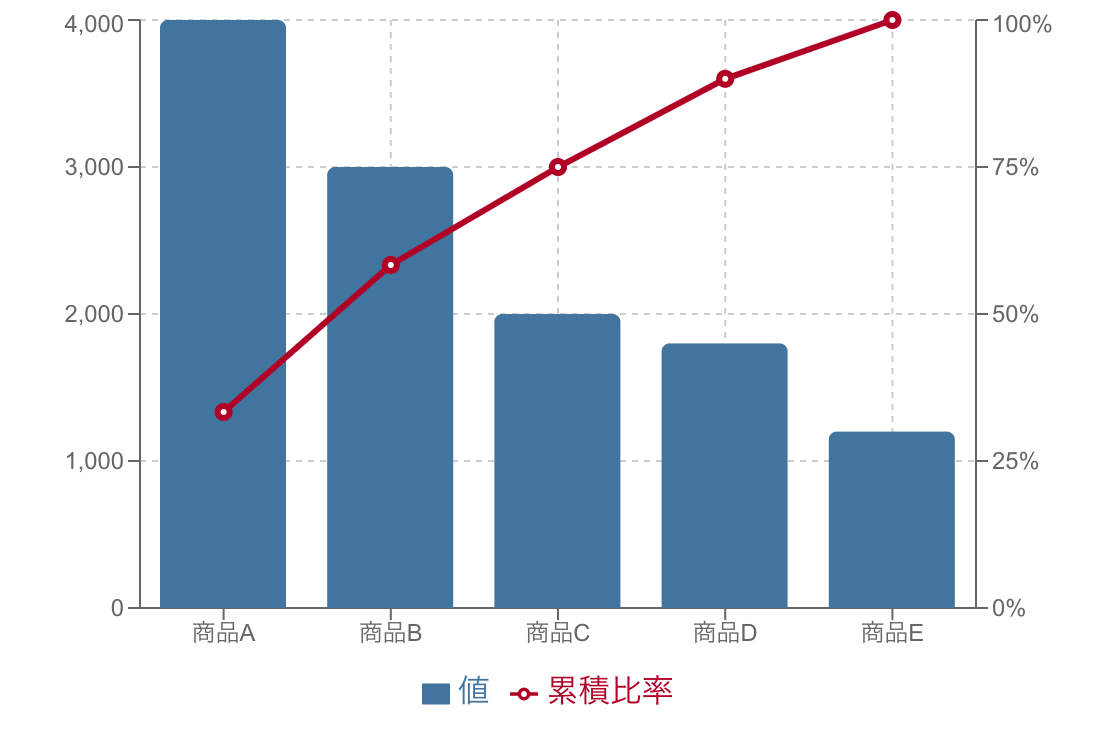
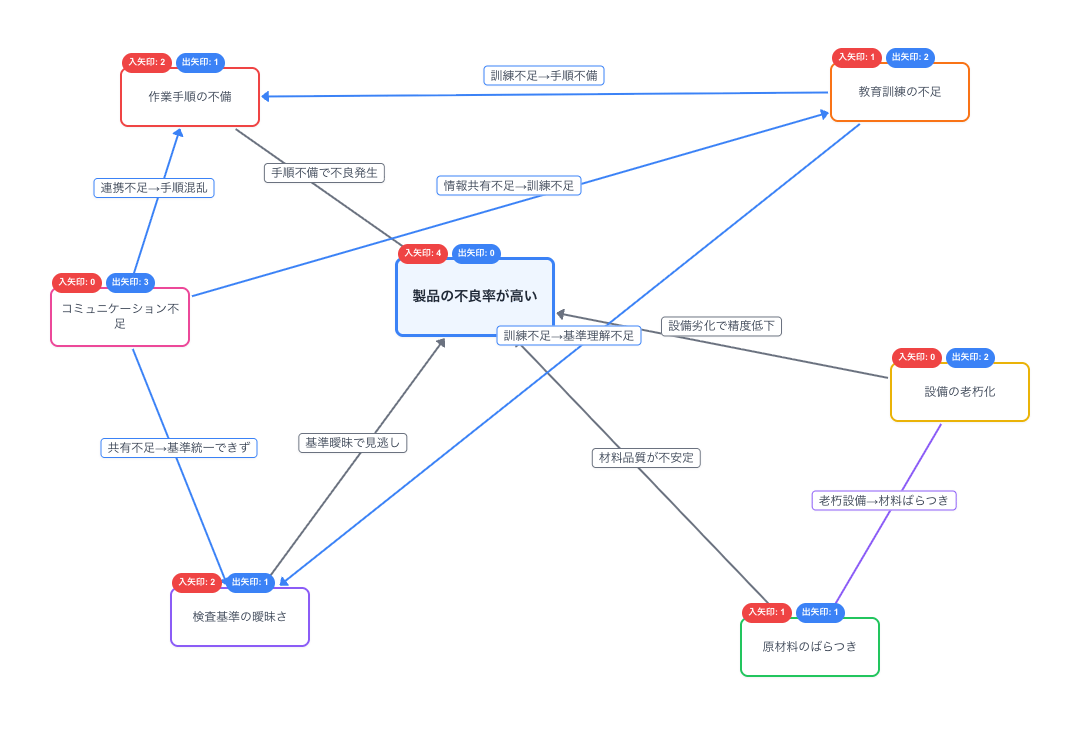
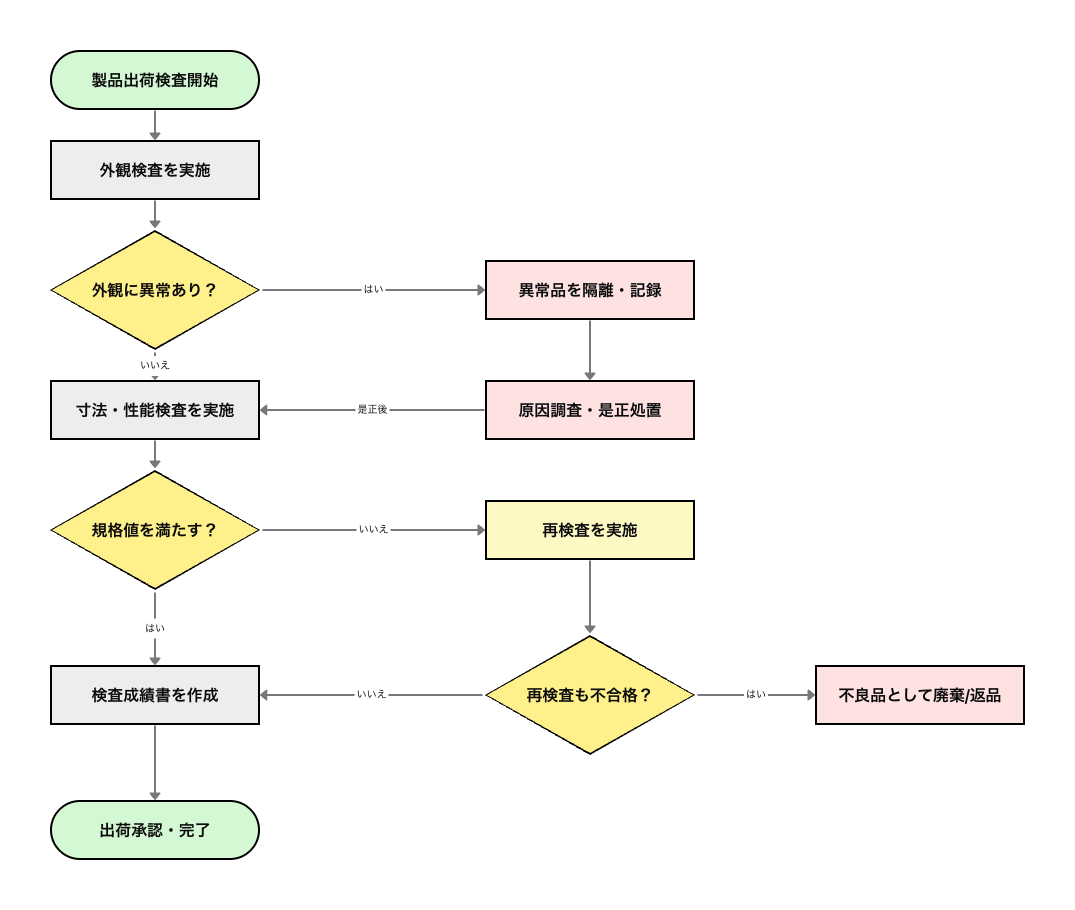
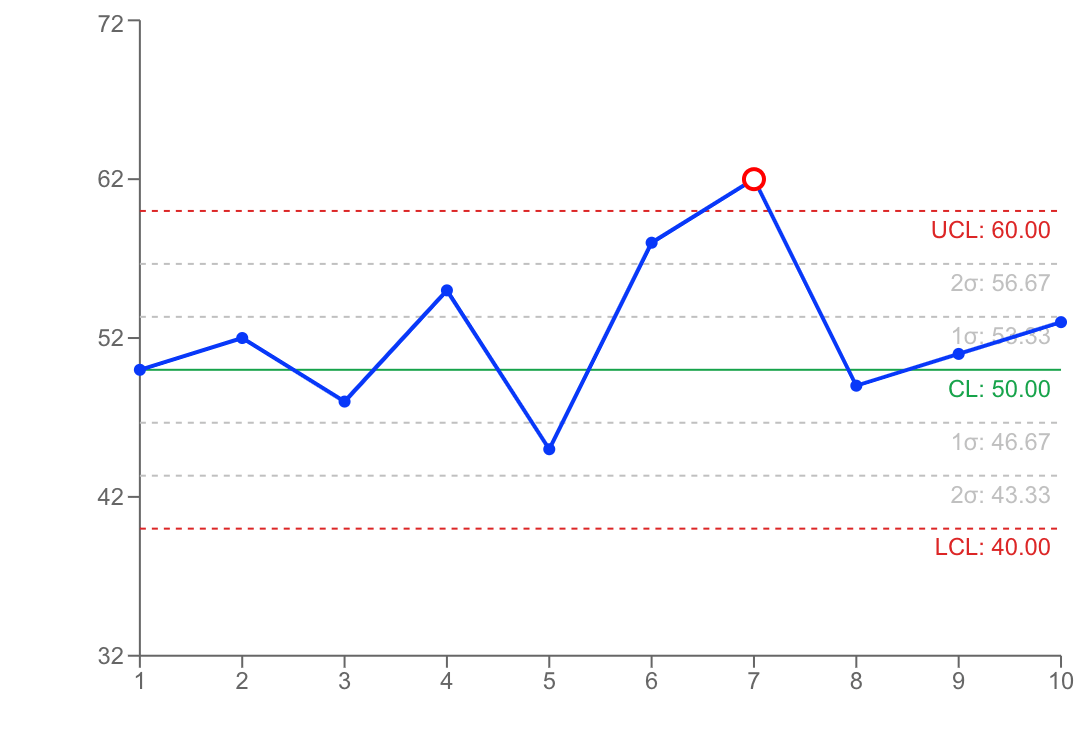
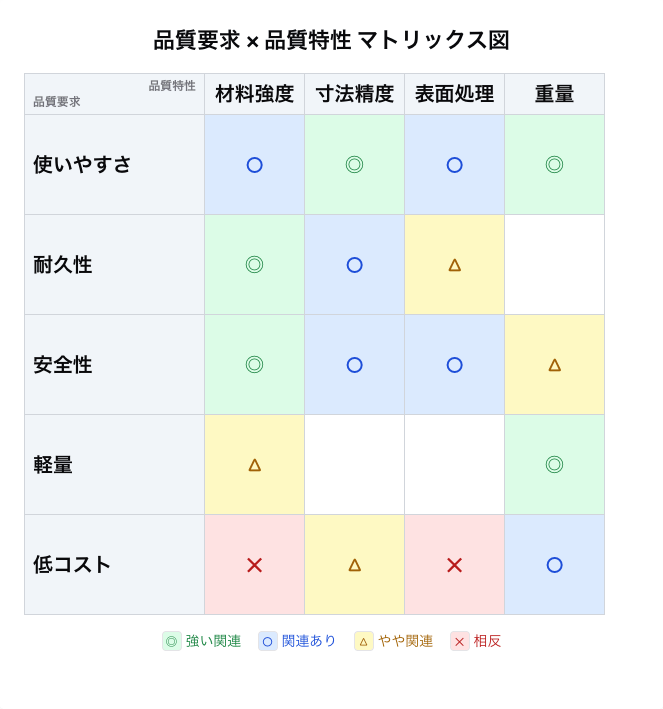
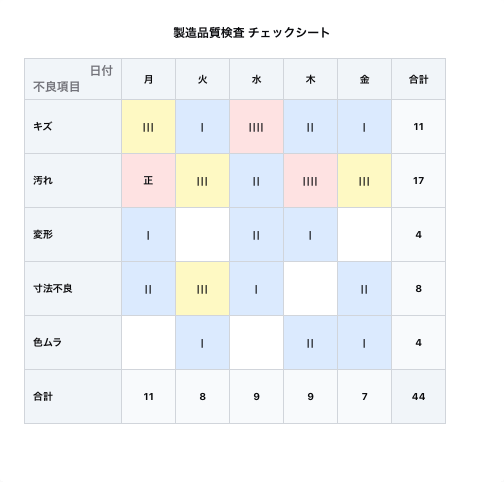
Quality Control (14)
Show data and processes related to quality control
Other (23)
Specialized graphs and diagrams that don't fit the above categories